Hi everyone,
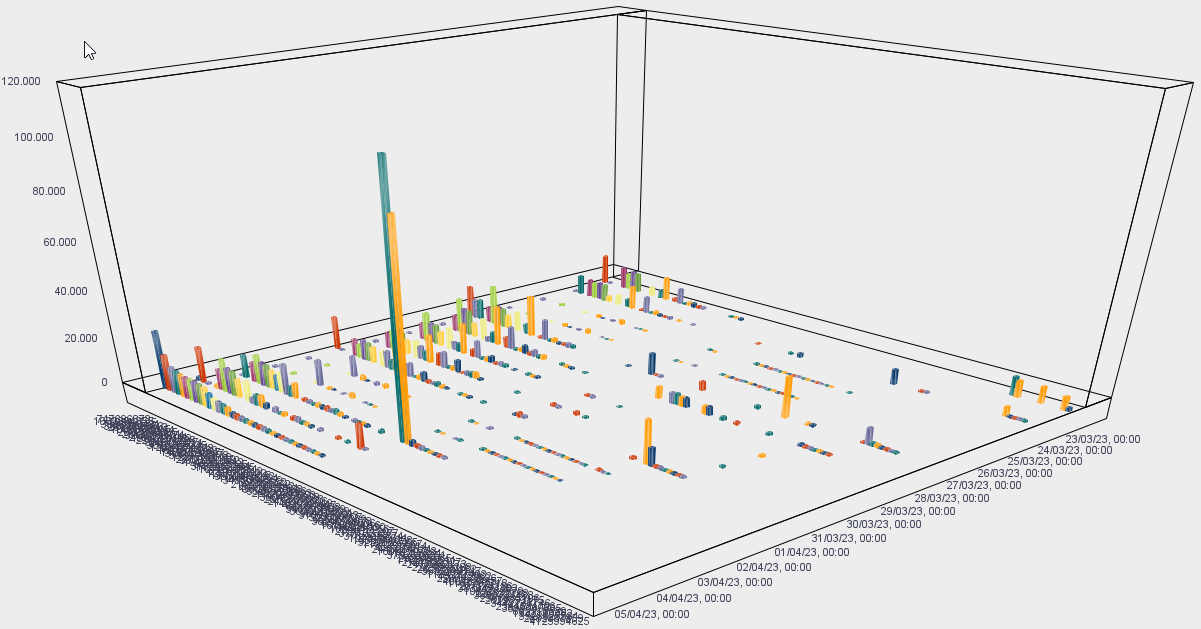
I'm new to Apex and struggling to create a chart. Can someone please help me create a chart similar to the one below
I would greatly appreciate any guidance or suggestions on best practices to achieve the desired outcome.
Can anyone help me?
(I'm working on Oracle APEX 22.2.0)
Best regards