I created a simple RMI server and client using the steps and programs mentioned at https://www.geeksforgeeks.org/remote-method-invocation-in-java/
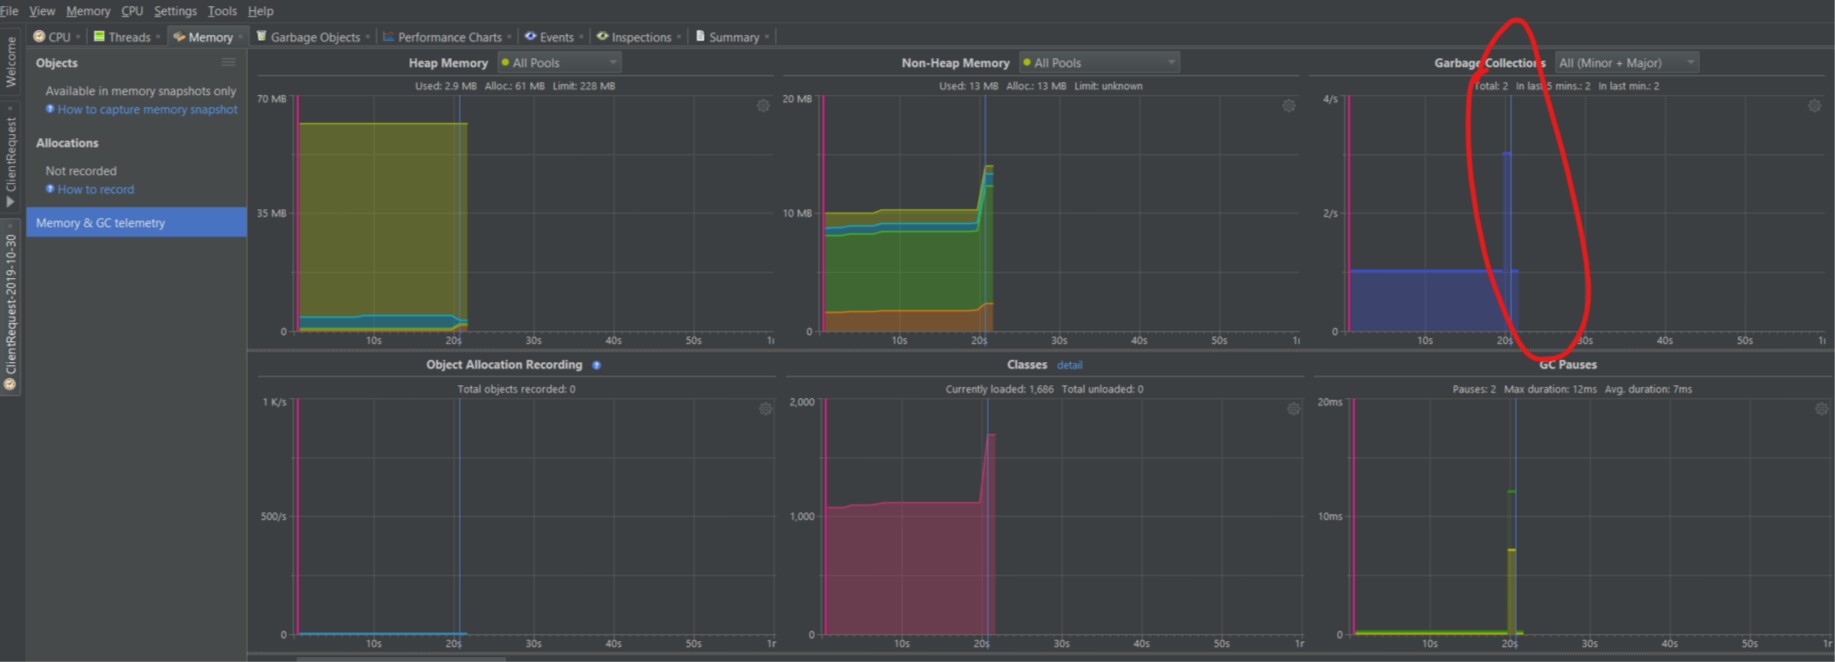
When I profile (using YourKit) the client program (ClientRequest.java), I see a spike in CPU (around 10% usage) and I also see a GC. I am curious about why this simple program is causing a GC. There is plenty of heap memory still available.
I can see "RMI RenewClean" and "RMI Scheduler" threads in the profiler. Are these threads causing the GC? I am wondering why a simple RMI call is causing GC. Could someone please provide some input? I attached YourKit snapshot here:
http://www.mediafire.com/file/jnlxk4mjv69xecs/ClientRequest-2019-10-30.snapshot/file
I tried searching on internet but couldn't find anything related.