This question is related to the behavior of the Min, Max, Avg, and Median functions in table views from which one or more columns have been excluded.
The report in question contains three attribute columns (LOB, Order Number, Office), one fact column (Revenue), and several custom calculation columns that use OBIEE's built-in aggregation functions Min, Max, Avg, Sum, and Median. We are using the Sample Sales Lite data source, and the XML definition for the report is included as an attachment to this post.
The first table view is shown here:
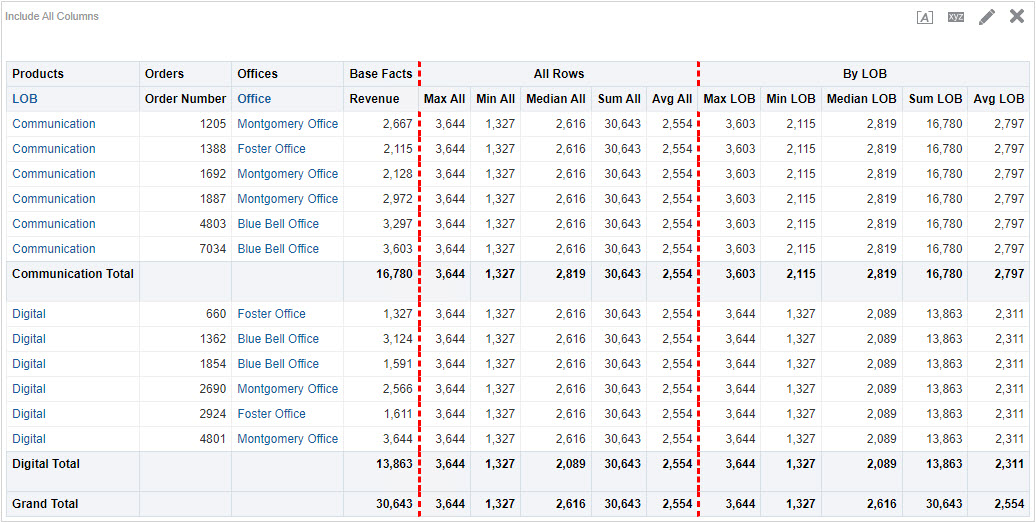
This first table view displays all columns, and returns correct results in every respect. The five aggregate functions (Max, Min, Median, Sum, Avg) return exactly what we would expect.
The first group of those 5 functions returns their respective values from the entire set of 12 rows of data. ("All Rows")
The second group returns the appropriate values within each LOB, using the BY <columname> parameter in each formula, such as median(REVENUE by LOB). For example, the median value for the Communication LOB shows $2,819. Because there are an even number of rows of data (six) for the Communication LOB, there is no single "middle" value available, so the Median is computed as the average of the two middle values of $2667 and $2972. The first table view returns exactly what I would expect. The subtotal and grand total lines are good as well.
Now let's look at the second table view, with a column excluded:
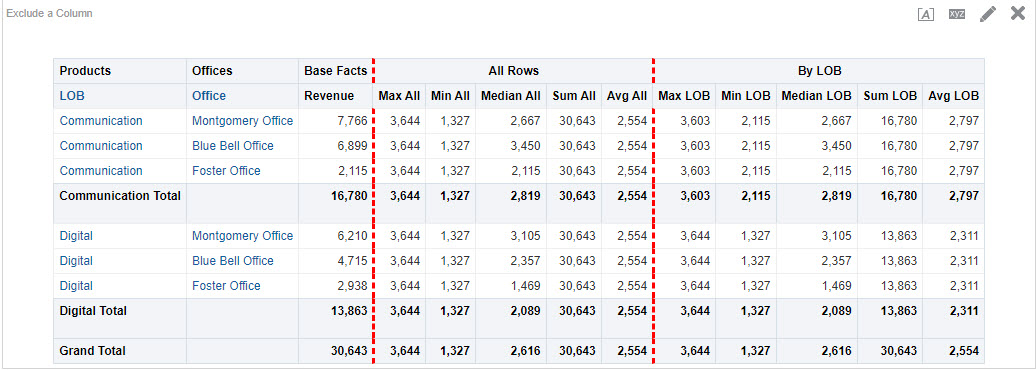
The second table view is the same report, but with one column excluded (Order Number). Let's take a look at the behavior of the five aggregate functions, starting with the MAX column in the “All Rows” group.
Someone looking at that table might ask "Why is Max All showing $3,644? I don't see $3,644 as one of the values in the Revenue column. I think it should return $7,766." From the point of view of someone looking only at the 2nd table, knowing nothing of the underlying rows or the excluded column, that's a perfectly reasonable expectation. If we are looking only at that table on a dashboard, a Max All of $3,644 appears to be wrong, as does the Min All of $1,327, where we might expect to see $2,115 instead.
And the Median All makes no sense at all. Are we, or are we not, considering all rows? The formula for Median All is median("Base Facts"."Revenue"). Why is there a different value for Median on each row? Answer: The Median function is not considering all rows. Instead, it is considering only those rows associated with the LOB and Office on a given row. And it is doing that because we have excluded a column.
The Sum All is correct. But the Avg All is not what is expected. We might expect to see the Sum All (30,643) divided the number of rows (6), resulting in an average of $5,107. But that's not the case. The denominator is not 6, it is 12, the total number of rows in the entire set of data returned to OBIEE by the database. So the average is being computed as 2,554, not 5,107.
Let's move on to the "LOB" set of columns. Max and Min behave just as they did in the "All" section. For the Communication LOB, Max and Min are computing their values based on the 6 rows of data in the main result set, not the 3 rows of data that are shown in the table after excluding the Contract ID column. So again, the Max and Min “appear” to be wrong to someone looking only at this second table.
Sum is OK. But Avg is again dividing by the number of rows in the main result set, not the number of visible rows in the table. Someone viewing this table might expect that the Avg for Communication should be 16,780 divided by 3, not divided by 6.
And, as noted earlier, the behavior of the Median function is different than what we might expect. The formula for Median LOB is this: median(REVENUE by LOB). On the first line of the 2nd table view we see Median LOB has a value of $2,667. Can we figure out where that number is coming from? Take a look at the first table again. There are three rows for the Communications LOB in the Montgomery office. What's the middle value from a sorted list of those three values? $2,667.
So again, there is a difference in behavior in the Median function when we start excluding columns from a view. In the 1st table, with no columns excluded, the Median LOB formula looks at ALL rows within the group (i.e. within each LOB). In the 2nd table, with a column excluded, the Median LOB formula considers only those rows associated with the combinations of LOB and the other visible columns on a given row. It no longer considers all rows for that entire LOB. The BY LOB clause is not picking up all rows for the entire LOB when there is an excluded column.
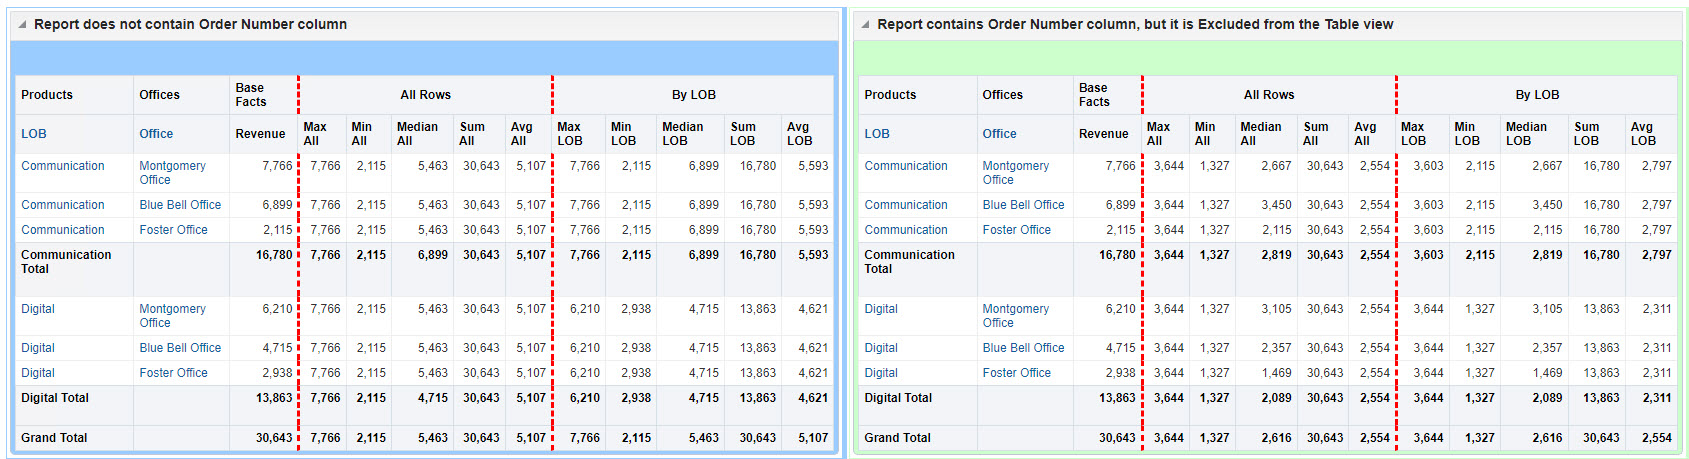
Indeed, think about this: Let's imagine two different reports. Report A is the report described above. Report B does not contain the Order Number column on the criteria tab. If we compare the results of the two reports, looking at the “excluded column” view from Report A and the table view from Report B, we will see different results. The “excluded column” table from from Report A would appear to be identically structured as the normal table view from Report B, but they would show different results. We could put the two table views side-by-side on a dashboard page and absolutely confuse the reader. Like this:
These functions undoubtedly have behaved in this fashion forever, so asking Oracle to reconsider their behavior is out of the question. As unexpected as the results may be, we're probably stuck with them the way they are.
But is there any way to accomplish the goal of making the 2nd table return results that can be easily understood without having to know the contents of the underlying data returned by the Criteria tab?
Stated more broadly, can we think of a way to compute maximum, minimum, average, and median in such a way that they return values that are context-sensitive within the structure of a given table or pivot table in which we've excluded one or more columns?