Hello Experts:
I have a DB performance issue and got AWR reports in my hand.
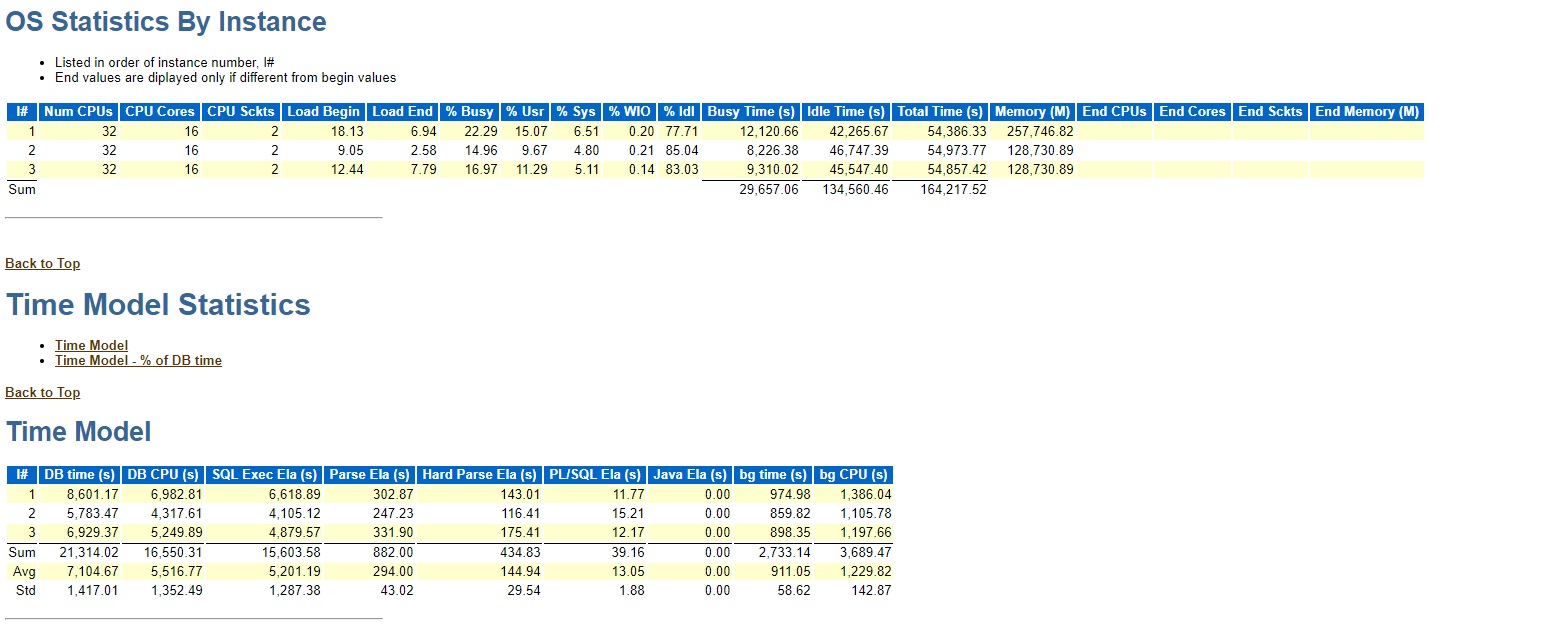
The OS Statistics and Time model is as below:
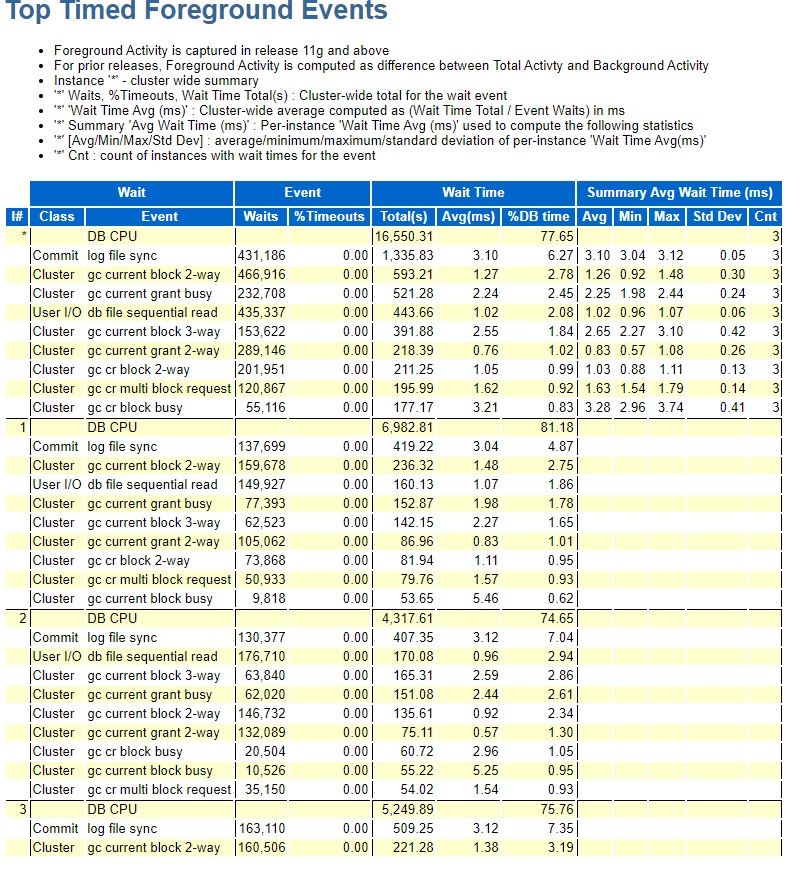
Top foreground events are as under:
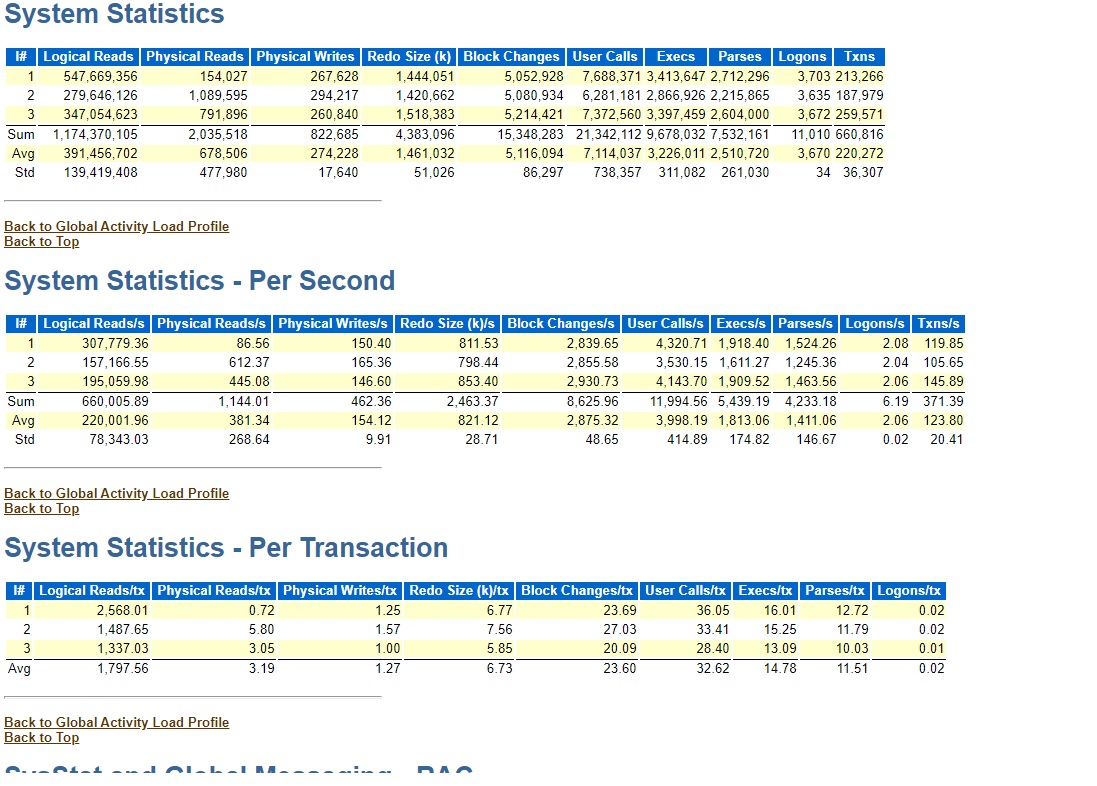
System Statistics show the below:
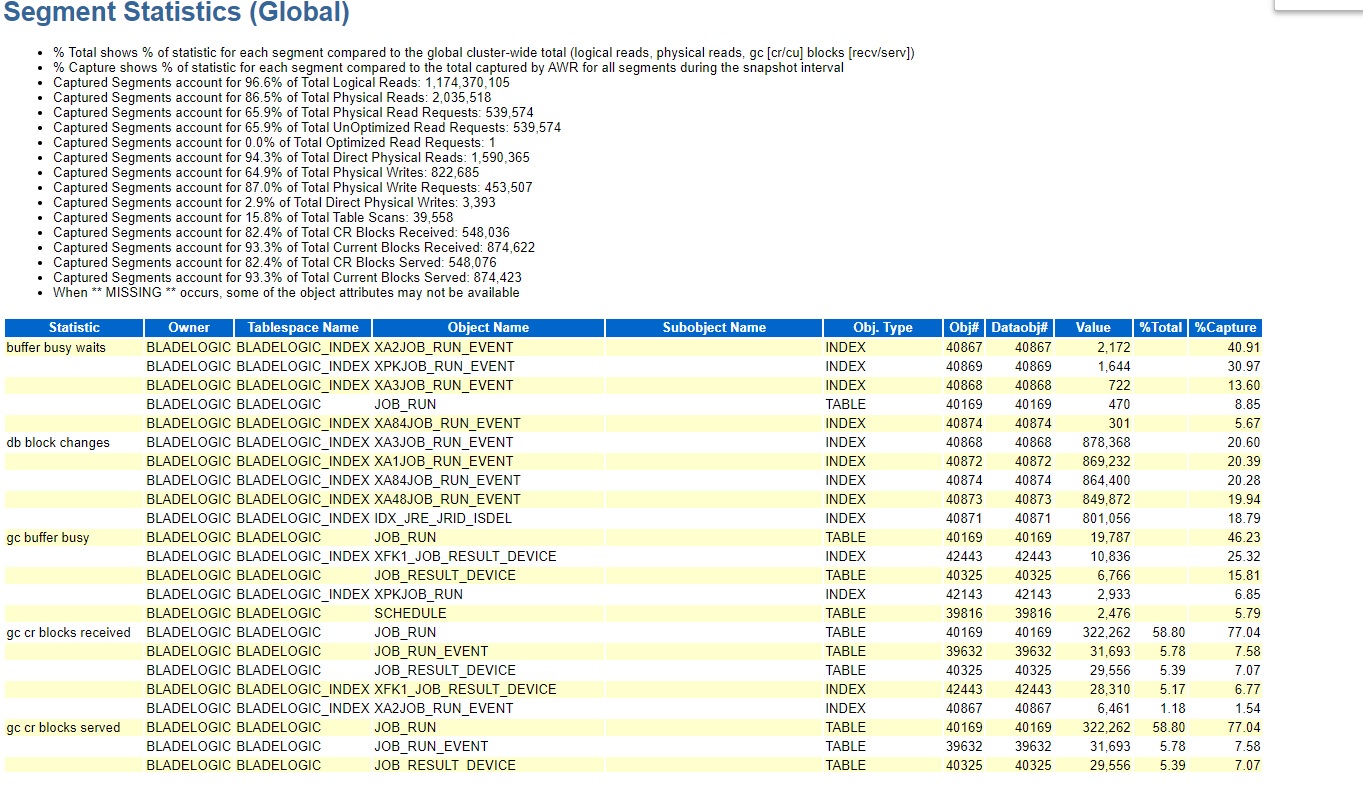
And Segment statistics show the below:
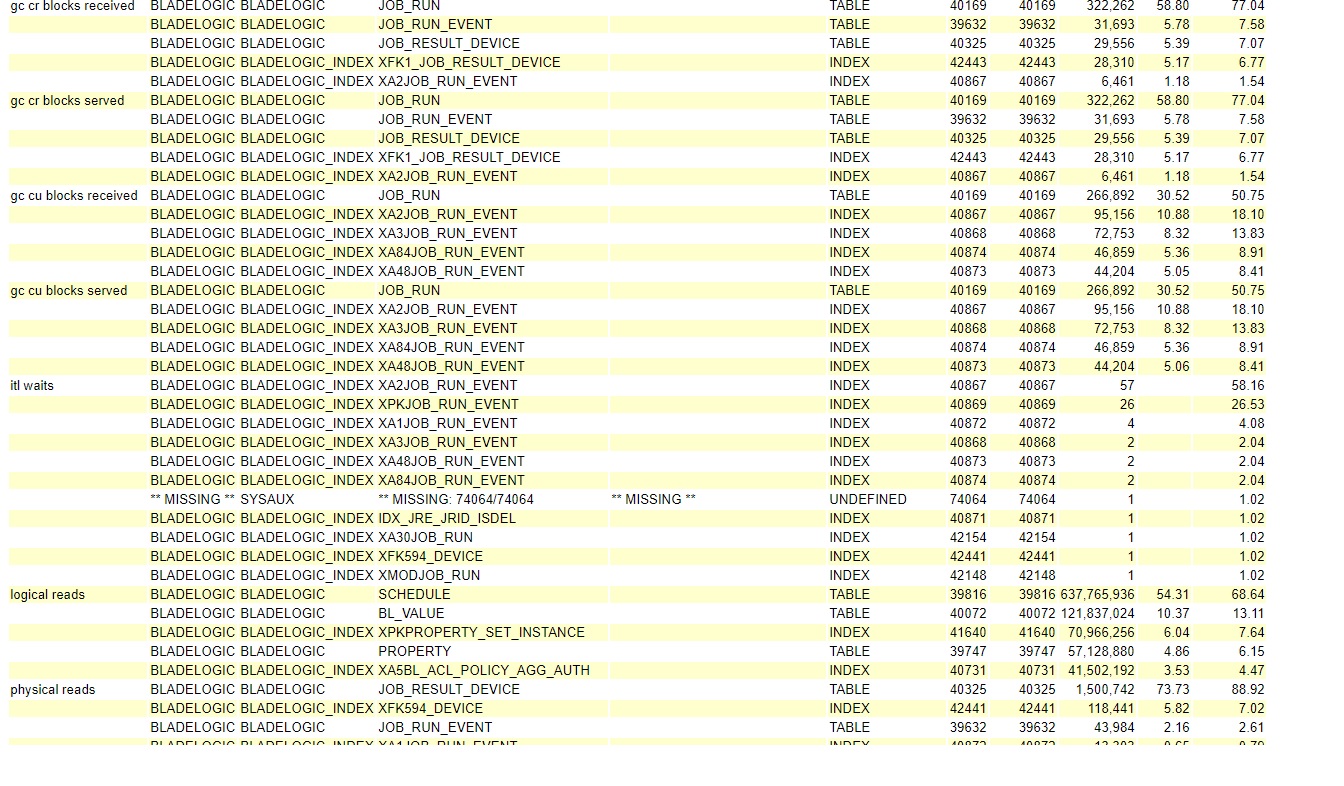
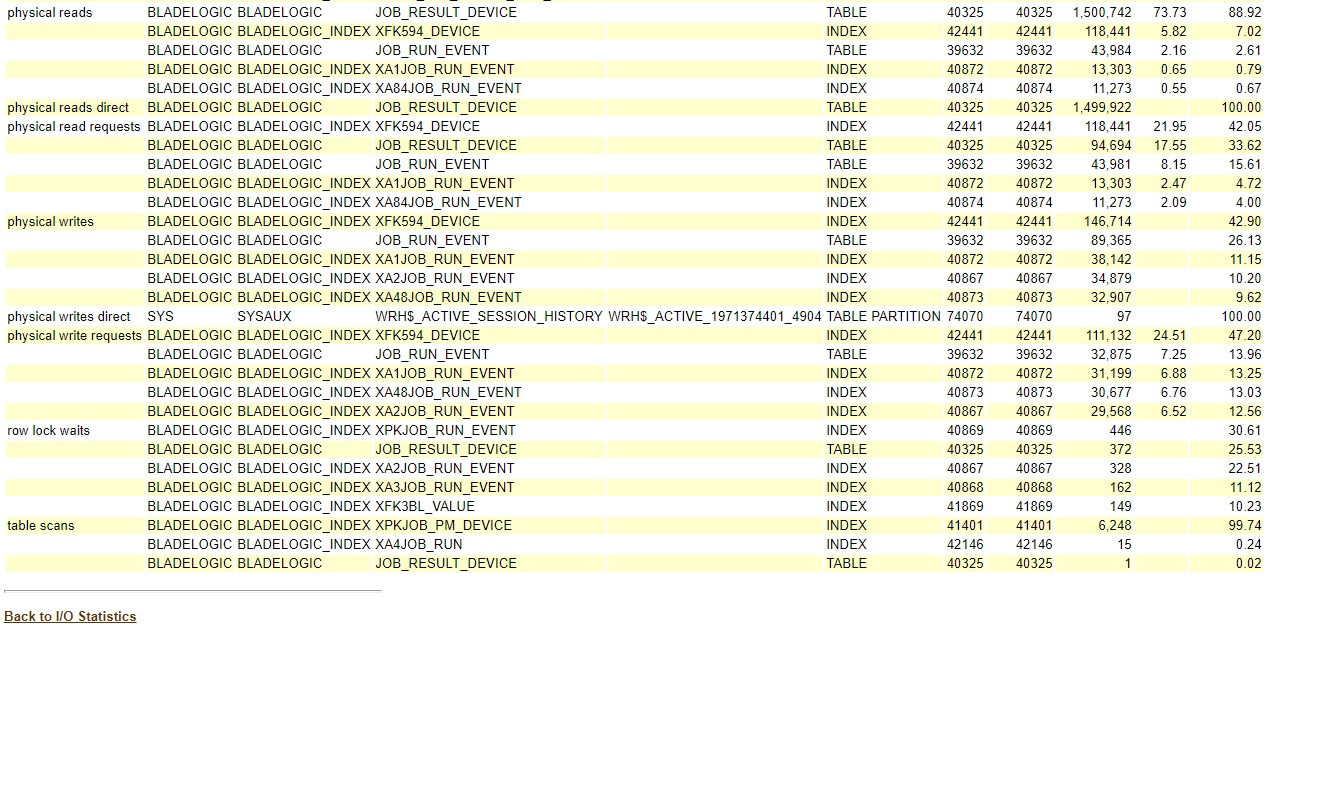
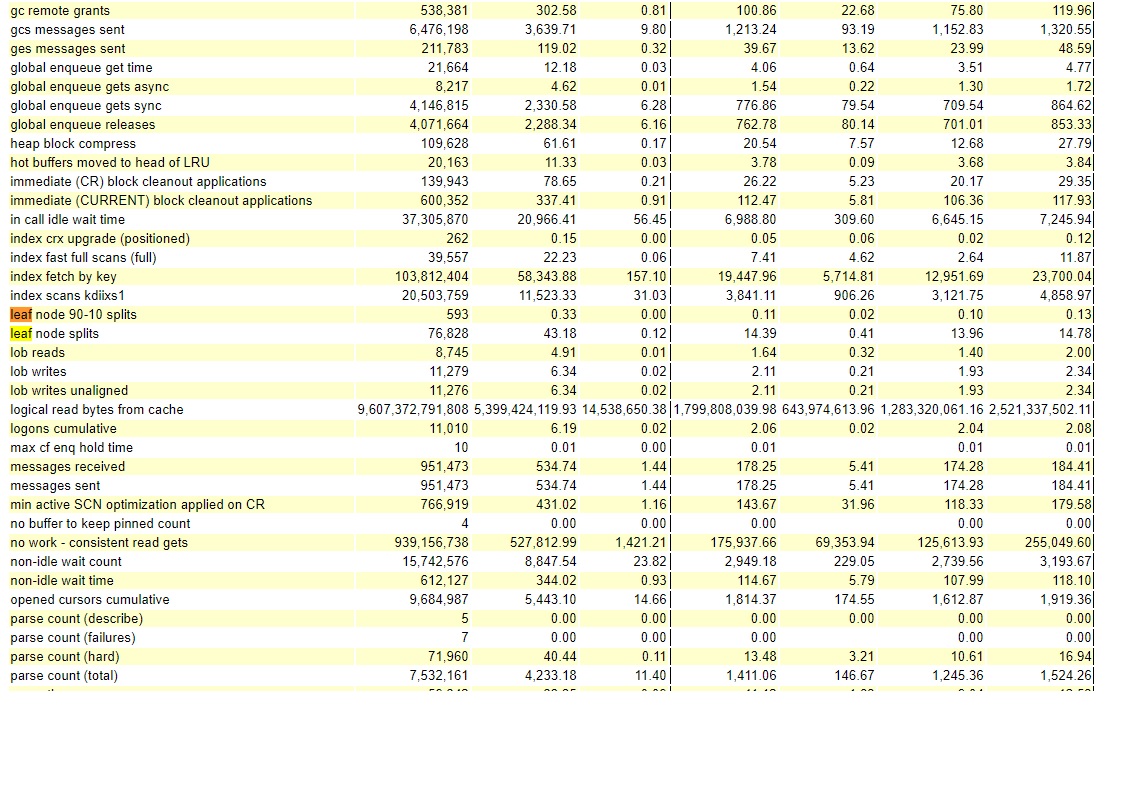
While the Global system statistics show leaf block splits
SQL Order by cluster wait shows a high value for some inserts
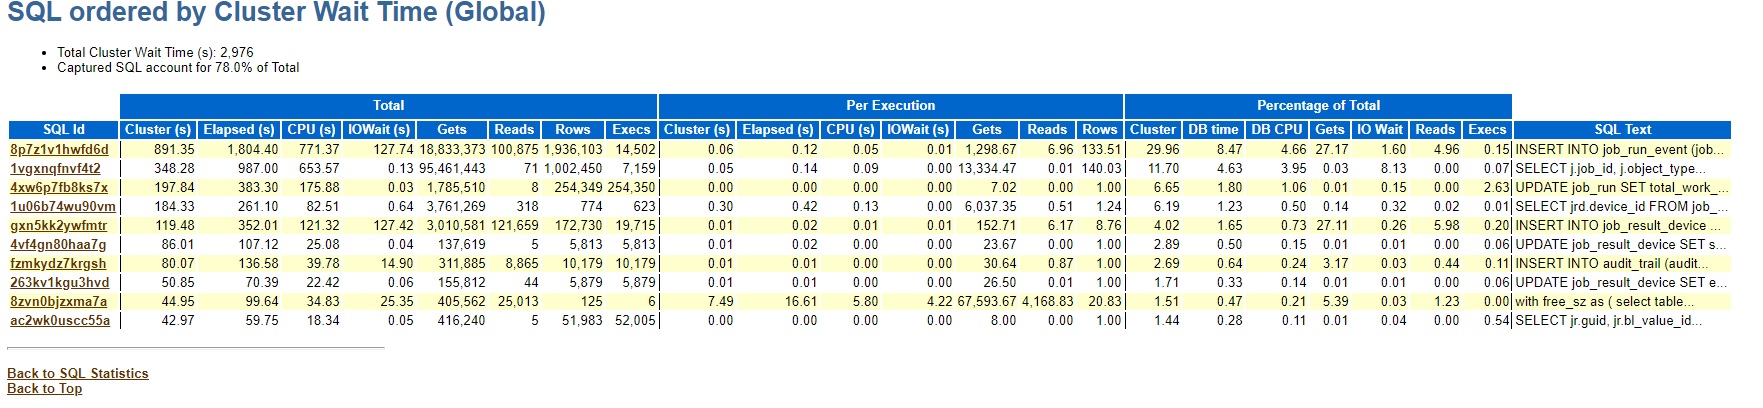
What i make out of it is:
- Figure out the usability of indexes on the table job_run_event. ITL wait events in segment statistics suggest that too many rows being added leading to lead node split? Thus at first question the number of so many indexes on the same table?
- Reduce the number of updates on job_run and job_result_device if possible?
- Considerable amount of DB time is actually spent on cluster sync up than actually heavily performing anything on the DB.
Please share your thoughts.
If you need any other screen shots, please do let me know. I'll get them.
Thank you.