Oracle 12.1.0.2 SE-2
Oracle Linux 6
I have a procedure that runs daily and reports (via email) the following:
select tablespace_name,
used_percent
        from DBA\_TABLESPACE\_USAGE\_METRICS

        where used\_percent > i\_alert\_pct

        order by used\_percent desc;
(i_alert is an put parm, currently set at 90)
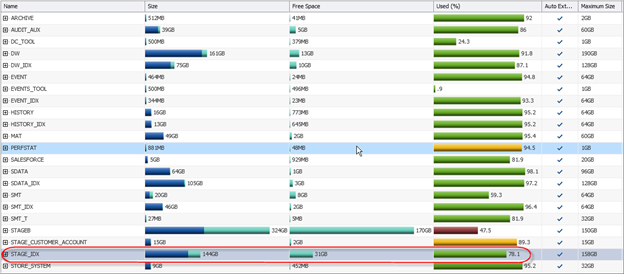
So to day I get a message that a TS had exceeded the 90%. No big deal, but I was rather surprised when I took a look at it in EM Express. There, it was reported at only 78.1% used, and several other TS not reported were showing over 90%.
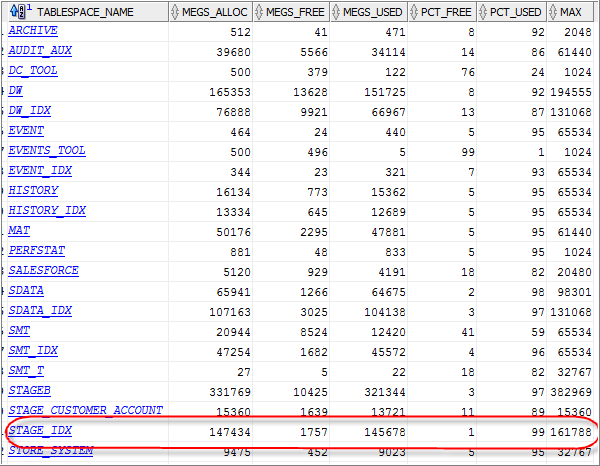
And in SQL Dev’s DBA tab, the same shows as 99% used
This leads to several questions.
1. Why is EM Express and SQL Dev reporting different % used for this TS? Notice that on some others, they agree.
2. Why would my query not get those other TS’s that either EM Express or SQL Dev (or both) say are over my 90% threshold?
- In EM Express, what does the colorization of the Used % bar mean? I’d think red is ‘danger’ but the one showing red is reporting only 47% used, while others well over 90% used are green. I don’t see any pattern or consistency there