I'm currently trying to get a Sunburst chart working, which is based on Highcharts.
This gives a good introduction for integrating Highcharts in APEX:
Integrate Highcharts.js in your Application
This one is a Sunburst example:
https://www.highcharts.com/demo/highcharts/sunburst
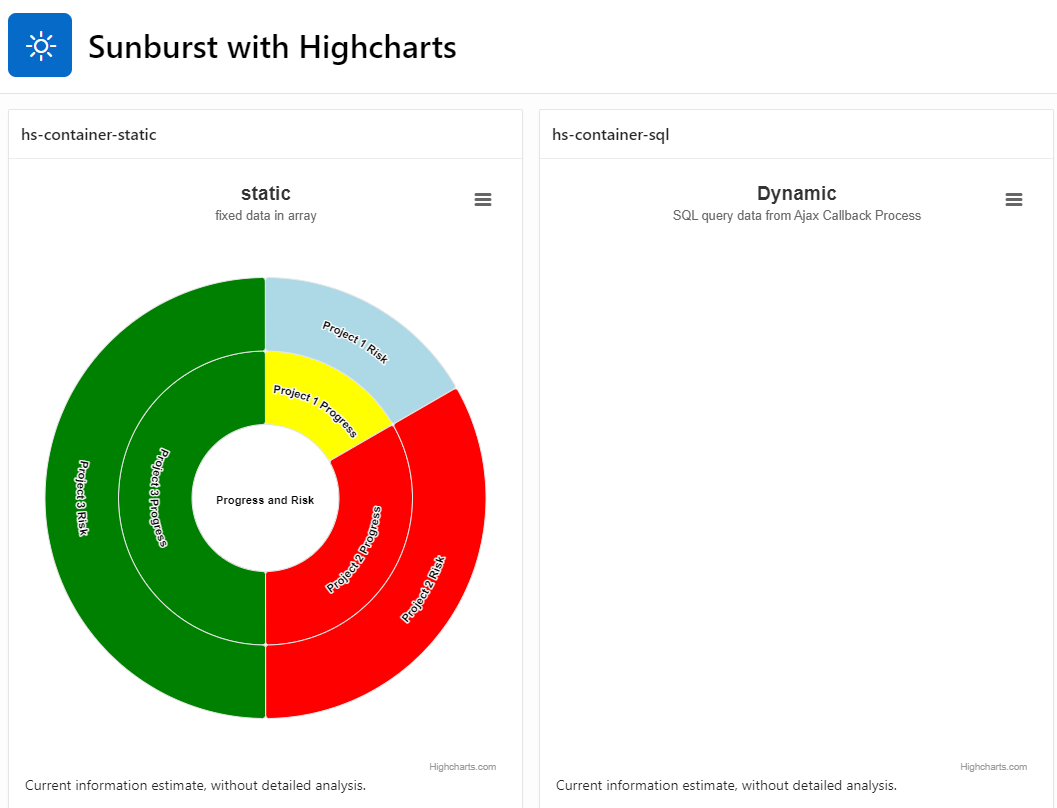
In my APEX app the Static chart is working, but the dynamic one is not working.
https://apex.oracle.com/pls/apex/r/jzzh/sunburst-with-highcharts
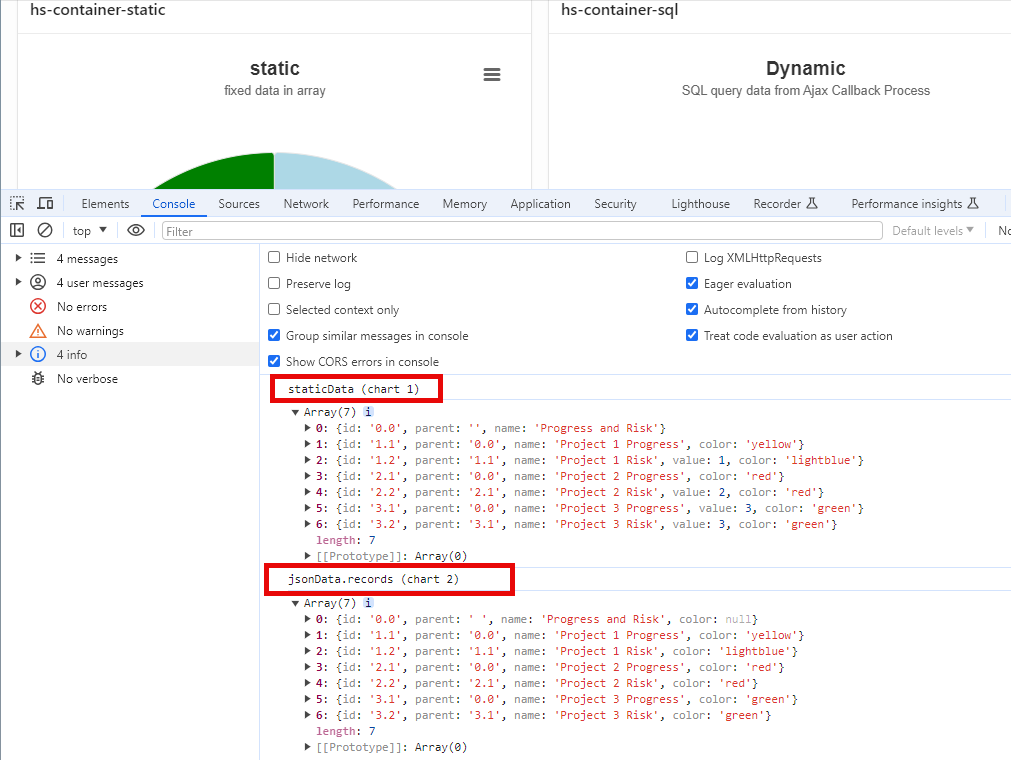
The output in the console is an array with 7 objects for both charts:
SQL source is this:
declare
 l_json clob;
begin
/*
 https://ducks-smash-afy.craft.me/lJR10LjXyJOuC3
 select json_object(
          'categories' value json_arrayagg( data.job order by data.job )
        , 'series'     value json_arrayagg( data.salary order by data.job )
        )
 into   l_json
*/
with t as (
    select '0.0' id, ' ' parent, 'Progress and Risk' name, null color  from dual union
    select '1.1' id, '0.0' parent, 'Project 1 Progress' name, 'yellow' color from dual union
    select '1.2' id, '1.1' parent, 'Project 1 Risk' name, 'lightblue' color from dual union
    select '2.1' id, '0.0' parent, 'Project 2 Progress' name, 'red' color from dual union
    select '2.2' id, '2.1' parent, 'Project 2 Risk' name, 'red' color  from dual  union
    select '3.1' id, '0.0' parent, 'Project 3 Progress' name, 'green' color from dual union
    select '3.2' id, '3.1' parent, 'Project 3 Risk' name, 'green' color from dual
)
select json_object(
   'records' value json_arrayagg (
       json_object (
       'id'      is id,
       'parent'  is parent,
       'name'    is name,
       'color'   is color
       )
   )
)
into l_json
from t;
htp.p( l_json );
end;
Execute when Page Loads
let lResponse = apex.server.process( "get_data", { loadingIndicator: '#hs-container-sql', loadingIndicatorPosition: 'centered' });

lResponse.done( function( jsonData ) {
      console.log('staticData (chart 1)');
      console.log(staticData);
      console.log('jsonData.records (chart 2)');
      console.log(jsonData.records);

( ... )

chart2 =  Highcharts.chart('hs-container-sql', {
       chart: {
           height: '600px'
       },
       // Let the center circle be transparent
       colors: ['transparent'].concat(Highcharts.getOptions().colors),
       title: {
           text: 'Dynamic'
       },
       subtitle: {
           text: 'SQL query data from Ajax Callback Process'
       },
       series: [{
           type: 'sunburst',
           data: jsonData.records,
Anyone has any idea why the second chart is not showing data ?
Thank you
Jochen