Hello Everyone,
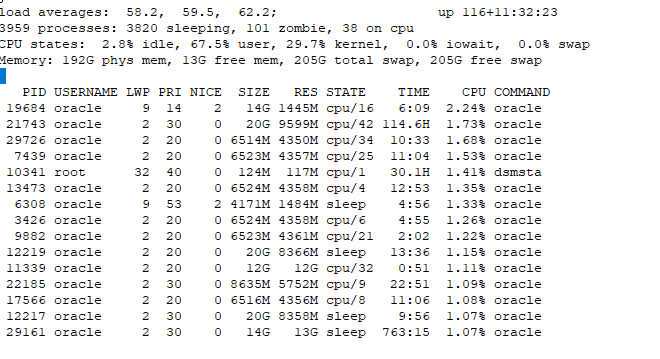
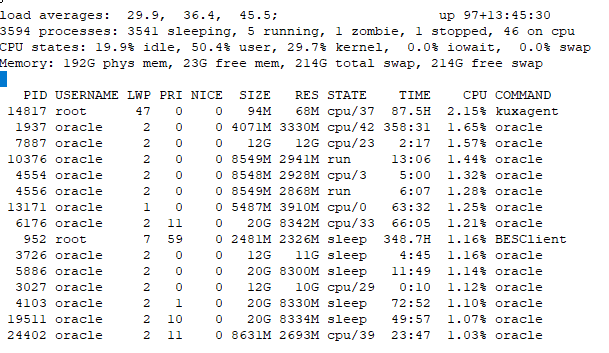
We see some strange issue hitting as our node 2 always goes to 100% cpu utilization and majority of time node 1 also close to 100% while node 3 always have some free CPU available. We also opened a case with oracle , but no benefit here. On this issue , we observed cpu on kernal side reached more then 30% almost all of the times and on this 3 node cluster , we have 11 instances running on each nodes.
CPU hitting100% one would always think of picking up the PID from top command , but that is not the case here. the maximum an Oracle session is using 1.5% and we never observed any session reaching beyond it. However , TFA sometime consumes more then 2% , but that too not exceeding more then 3%. on all the box.
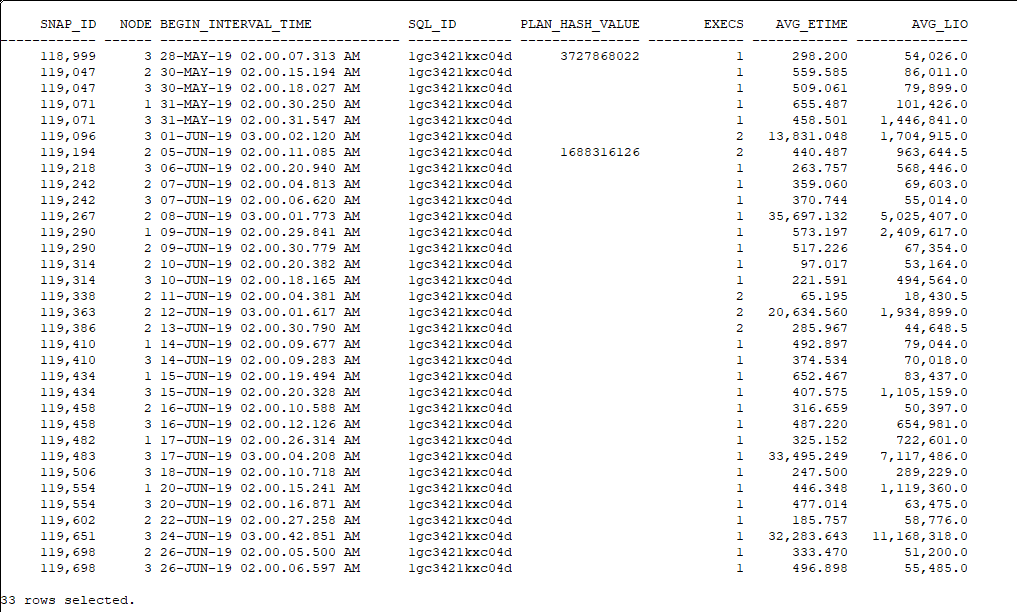
Also, in addition to it, we tried to identify which of the instance is using most of the CPU across all the instances on the server and we did see. one of instance found to be used maximum of total CPU available on the server and it was around to be 13% and we did tried to see , if there are any plan change which is causing server CPU to burn very rapidly. We did try to use one of the script used to find out what all plans on the database can experiencing the plan flip flop. Following is the output we found that hash value 3727868022 being used till the 05-JUN-19 02.00.11.085 AM and after that the plan change has happened (the blank lines means the hash value remain same until the new one appears) Here, I am unable to understand when the execution was 1 the AVG_ETIME which is average elapsed time is much lesser like 298 seconds and with 2 execution , it bumped up to many folds with the same has value. Not sure ,why this is so and if I am focusing on right direction to troubleshoot issue. Please help me here to provide some guidance
Server type
SunOS node_1 5.10 Generic_150400-64 sun4u sparc SUNW,SPARC-Enterprise

Node 2

Node 1 .. this time , I was lucky enough to see some CPU being available on node 1

Node 3

Regards