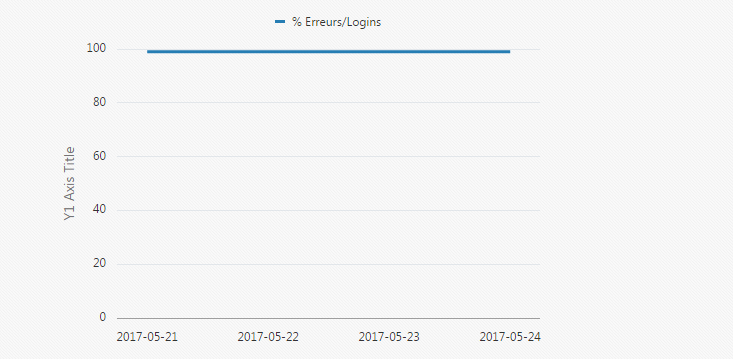
I'm trying to make a line a dual Y line chart with 1 y Axis at % (range between 99% and 100%). Used the http://www.oracle.com/webfolder/technetwork/jet/jetCookbook.html?component=lineChart&demo=dualY as a starting point. I can't seem to find how to specify a min and a max on my Y Axis so it looks like this:
this is the code
<div id="lineChart" data-bind="ojComponent: {
        component: 'ojChart',

        type: 'line',

        series: lineSeriesValue,

        groups: lineGroupsValue,

        animationOnDisplay: 'auto',

        animationOnDataChange: 'auto',

        orientation: orientationValue,

        splitDualY: dualY,

        splitterPosition: splitterValue,

        legend: {position: 'top'},

        yAxis: {title: 'Y1 Axis Title'},

        y2Axis: {title: ''}

    }"

     style="max-width:500px;width:100%;height:350px;">
I've tried to use the yAxis.dataMin and yAxis.dataMax: yAxis: {title: 'Y1 Axis Title', dataMin: '99', dataMax: '100'}
but it doesn't seem to work..
Any suggestions?
Tkx