Hello!
I just got into a project where we aimed to performance test a scaleio storage for our customer.
We wanted to measure various scenarios and indicators, but as a starting point we wanted to see
- the maximum IOPS for Oracle Database single block 8k reads that can be achieved from a single host.
- the response time (again from Oracle's perspective) for the same single block 8k reads
We were using Oracle 12.2 on Linux. 2 Socket, 12 core, 24 threads on the non-virtual host. The details do not really matter I think.
SLOB was set up with 512 users, 1 GB each, update percent 0, no hotspot, no table scan.
The db is a RAC db, but in these tests we were stressing just one instance.
We were supposed to demonstrate sub millisecond response times for db file sequential read to make the case for the storage system.
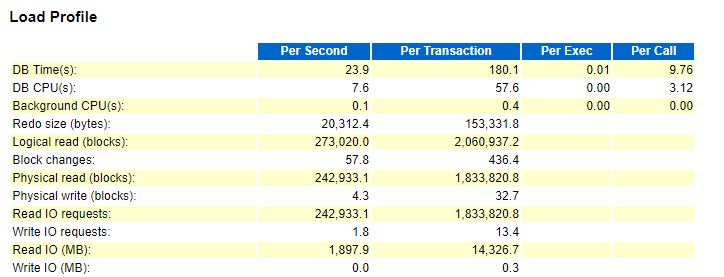
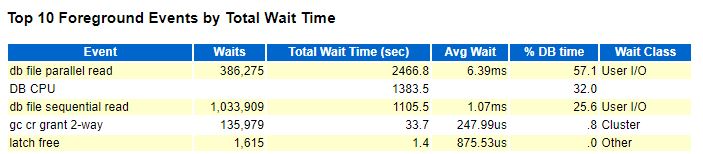
TEST DEFAULT 24 threads
Running slob in 24 threads we achieved 243k IOPS, 1.07ms for average db file sequential read, but we were expecting a much better response time in the range of ~0.2ms.
Then I read few internet pages about db file parallel read and the reasons behind we see this event. I also found the simple.ora file in the SLOB directory.
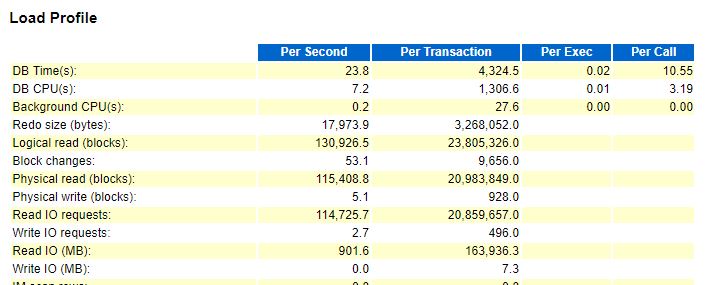
TEST WITH UNDERSCORE PARAMETERS 24 THREADS
So then I set the 3 underscore parameters as seen below:
# The following are needed to force db file sequential read. Omit for direct path short scans.
# If you would like to investigate a blend of short scans mixed with single-block random I/O
# then comment out these three parameters :
_db_block_prefetch_limit = 0
_db_block_prefetch_quota = 0
_db_file_noncontig_mblock_read_count = 0
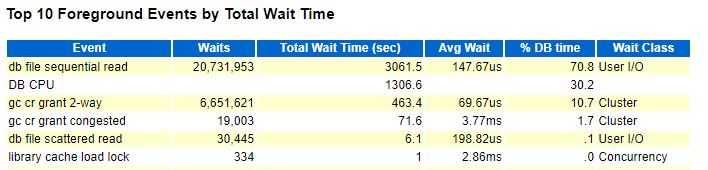
And the results were:
My observations:
-
the IOPS is better with the Oracle default supplied parameters. (more than twice as good). This means that the Oracle IO optimizations work quite well for throughput
-
the response time is much better with the underscore parameters. If you look at the average db file sequential read value the improvement is 7.2x.
Knowing that things are more complex than this average values I have some questions. Please share your thoughts and experience.
Q1) How exactly db file parallel read is measured? Does the timing start when the first peace of request is submitted to the OS and end when the last response is received? Or are the individual parallel requests measured independently and then their values aggregated for the event?
Q2) How come that in the first test (with default parameters) the db file sequential read event averaged worse than in the second test? In other words why were the single block reads in the first test worse than the single block reads in the second test? Is it possible that we measured in the first test case only those "bad db file sequential reads" that for some reason were not grouped and thus did not became "db file parallel reads"?
Q3) Would you ever ask Oracle Support the permission of setting these parameters if you had a response time sensitive OLTP system under your supervision?
Share your thoughts with me.
Cheers,
RobK