Hello,
I am new to this Forum, I am not sure that I am posting the question under the right Category.., Please let me know in case anyone had similar situation.
I have multiple Java Modules connects to Oracle Database, Our Technical stack is JAVA Hibernate and CP30 Connection pooling.
Most of modules are multithreaded so there is large number of connections will be established and query for different table. But there are some particular select query Run very quick at times but takes much more longer execution time some time. For example it would run normally less than a sec, but some times it goes up to 5 min.
I have investigated the load or possibility of any other overhead on database server, But nothing as such noticed !
I have APP dynamics instrumented to Database server I can see CPU, Memory or other metrics looks good at the time query takes longer time.
If I deep dive more on to that single execution I find 68% of time is consumed by Cell single block request.
Below is sample Query
 select *
from Table1 s where sys_fl_que_id in (
select sys_fl_que_id
from Table2 w where w.work_que_id = s.work_que_id
and sys_proc_id = :1
and stat_cde = ?
and actn_cde_id in (
select actn_cde_id
from Table3 where nm_val in (:2 ) ) )
and rownum < :3
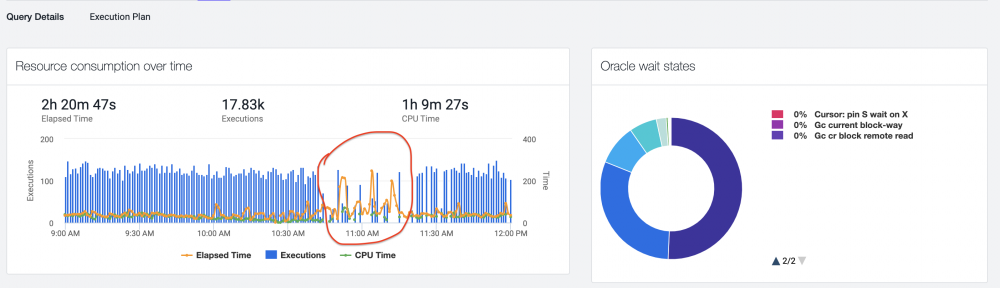
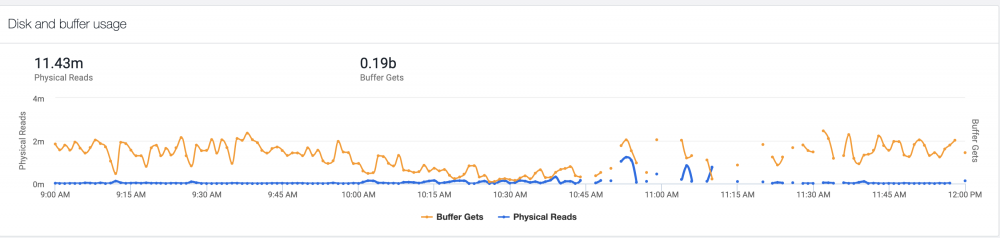
Some of the Metrics