[EDITED on 25 April 2023, in order to restore the original text formats, lost in the migration to the new Forums software.]
Tested on: SQL Developer 21.4.3
TL;DR: Metrics are not correctly aggregated for parallel queries (wrong values).
Using a simple table of 100 M rows and close to 1 M database blocks (block size: 8 kb), the following test query is run:
select *
  from scott.tab100m
 where rgn = 1000;
The table is purposely not indexed, in order to force a full table scan. The test query is run, first without parallelism, then at DOP 2, using the hint /*+ parallel(2) */, then at DOP 4, then DOP 8, and finally DOP 16.
The DB is Oracle 19.9 on a development LAB setup on an old desktop PC. The "storage subsystem" is a single SATA SSD disk, capable of delivering roughly 270 Mb/s of sequential reads but not much more. So of course we expect absolutely no gain from parallelizing, and the I/O read throughput is expected to be boringly the same regardless of DOP.
(Note: the table segment is close to 8 Gb, which is a lot bigger than the buffer cache on this DB; nevertheless, the buffer cache is flushed before each test.)
Sure enough, all queries complete in just about 30s. Here are the SQL Monitoring reports in text format:
1/ Without parallel query
Global Information
------------------------------
 Status              :  DONE (ALL ROWS)
 Instance ID         :  1
 Session             :  PDB_ADMIN (2:31925)
 SQL ID              :  5qy6qj82wa042
 SQL Execution ID    :  16777216
 Execution Started   :  04/27/2022 17:17:31
 First Refresh Time  :  04/27/2022 17:17:34
 Last Refresh Time   :  04/27/2022 17:18:00
 Duration            :  29s
 Module/Action       :  SQL Developer/-
 Service             :  pdb_rva
 Program             :  SQL Developer
 Fetch Calls         :  1

Global Stats
================================================================
| Elapsed |   Cpu   |    IO    | Fetch | Buffer | Read | Read  |
| Time(s) | Time(s) | Waits(s) | Calls |  Gets  | Reqs | Bytes |
================================================================
|      29 |    8.18 |       21 |     1 |   998K | 7815 |   8GB |
================================================================

SQL Plan Monitoring Details (Plan Hash Value=2989339762)
==================================================================================================================================================
| Id |      Operation      |  Name   |  Rows   | Cost  |   Time    | Start  | Execs |   Rows   | Read | Read  | Activity |    Activity Detail    |
|    |                     |         | (Estim) |       | Active(s) | Active |       | (Actual) | Reqs | Bytes |   (%)    |      (# samples)      |
==================================================================================================================================================
|  0 | SELECT STATEMENT    |         |         |       |           |        |     1 |          |      |       |          |                       |
|  1 |   TABLE ACCESS FULL | TAB100M |       1 | 83112 |        29 |     +1 |     1 |        0 | 7815 |   8GB |   100.00 | Cpu (6)               |
|    |                     |         |         |       |           |        |       |          |      |       |          | direct path read (23) |
==================================================================================================================================================
2/ At DOP 2
Global Information
------------------------------
 Status              :  DONE (ALL ROWS)
 Instance ID         :  1
 Session             :  PDB_ADMIN (368:43804)
 SQL ID              :  0fdwdqxtnt26v
 SQL Execution ID    :  16777216
 Execution Started   :  04/27/2022 17:31:51
 First Refresh Time  :  04/27/2022 17:31:51
 Last Refresh Time   :  04/27/2022 17:32:20
 Duration            :  29s
 Module/Action       :  SQL Developer/-
 Service             :  pdb_rva
 Program             :  SQL Developer
 Fetch Calls         :  1

Global Stats
================================================================
| Elapsed |   Cpu   |    IO    | Fetch | Buffer | Read | Read  |
| Time(s) | Time(s) | Waits(s) | Calls |  Gets  | Reqs | Bytes |
================================================================
|      58 |    8.61 |       49 |     1 |   998K | 7841 |   8GB |
================================================================

Parallel Execution Details (DOP=2 , Servers Allocated=2)
===================================================================================================================
|      Name      | Type  | Server# | Elapsed |   Cpu   |    IO    | Buffer | Read | Read  |      Wait Events      |
|                |       |         | Time(s) | Time(s) | Waits(s) |  Gets  | Reqs | Bytes |      (sample #)       |
===================================================================================================================
| PX Coordinator | QC    |         |    0.02 |    0.02 |     0.00 |      5 |    1 |  8192 |                       |
| p000           | Set 1 |       1 |      29 |    4.34 |       25 |   500K | 3929 |   4GB | direct path read (24) |
| p001           | Set 1 |       2 |      29 |    4.25 |       25 |   498K | 3911 |   4GB | direct path read (26) |
===================================================================================================================

SQL Plan Monitoring Details (Plan Hash Value=3054524963)
======================================================================================================================================================
| Id |       Operation        |   Name   |  Rows   | Cost  |   Time    | Start  | Execs |   Rows   | Read | Read  | Activity |    Activity Detail    |
|    |                        |          | (Estim) |       | Active(s) | Active |       | (Actual) | Reqs | Bytes |   (%)    |      (# samples)      |
======================================================================================================================================================
|  0 | SELECT STATEMENT       |          |         |       |           |        |     3 |          |      |       |          |                       |
|  1 |   PX COORDINATOR       |          |         |       |           |        |     3 |          |    1 |  8192 |          |                       |
|  2 |    PX SEND QC (RANDOM) | :TQ10000 |       1 | 62141 |           |        |     2 |          |      |       |          |                       |
|  3 |     PX BLOCK ITERATOR  |          |       1 | 62141 |           |        |     2 |          |      |       |          |                       |
|  4 |      TABLE ACCESS FULL | TAB100M  |       1 | 62141 |        29 |     +1 |    27 |        0 | 7840 |   8GB |   100.00 | Cpu (6)               |
|    |                        |          |         |       |           |        |       |          |      |       |          | direct path read (50) |
======================================================================================================================================================
3/ At DOP 4
Global Information
------------------------------
 Status              :  DONE (ALL ROWS)
 Instance ID         :  1
 Session             :  PDB_ADMIN (368:43804)
 SQL ID              :  cfu36xfabsjtq
 SQL Execution ID    :  16777216
 Execution Started   :  04/27/2022 17:38:59
 First Refresh Time  :  04/27/2022 17:38:59
 Last Refresh Time   :  04/27/2022 17:39:28
 Duration            :  29s
 Module/Action       :  SQL Developer/-
 Service             :  pdb_rva
 Program             :  SQL Developer
 Fetch Calls         :  1

Global Stats
================================================================
| Elapsed |   Cpu   |    IO    | Fetch | Buffer | Read | Read  |
| Time(s) | Time(s) | Waits(s) | Calls |  Gets  | Reqs | Bytes |
================================================================
|     116 |    9.26 |      107 |     1 |   998K | 7865 |   8GB |
================================================================

Parallel Execution Details (DOP=4 , Servers Allocated=4)
===================================================================================================================
|      Name      | Type  | Server# | Elapsed |   Cpu   |    IO    | Buffer | Read | Read  |      Wait Events      |
|                |       |         | Time(s) | Time(s) | Waits(s) |  Gets  | Reqs | Bytes |      (sample #)       |
===================================================================================================================
| PX Coordinator | QC    |         |    0.02 |    0.02 |     0.00 |      5 |    1 |  8192 |                       |
| p000           | Set 1 |       1 |      29 |    2.35 |       27 |   254K | 2009 |   2GB | direct path read (25) |
| p001           | Set 1 |       2 |      29 |    2.29 |       27 |   248K | 1951 |   2GB | direct path read (27) |
| p002           | Set 1 |       3 |      29 |    2.32 |       27 |   248K | 1953 |   2GB | direct path read (25) |
| p003           | Set 1 |       4 |      29 |    2.28 |       27 |   248K | 1951 |   2GB | direct path read (27) |
===================================================================================================================

SQL Plan Monitoring Details (Plan Hash Value=3054524963)
=======================================================================================================================================================
| Id |       Operation        |   Name   |  Rows   | Cost  |   Time    | Start  | Execs |   Rows   | Read | Read  | Activity |    Activity Detail     |
|    |                        |          | (Estim) |       | Active(s) | Active |       | (Actual) | Reqs | Bytes |   (%)    |      (# samples)       |
=======================================================================================================================================================
|  0 | SELECT STATEMENT       |          |         |       |           |        |     5 |          |      |       |          |                        |
|  1 |   PX COORDINATOR       |          |         |       |           |        |     5 |          |    1 |  8192 |          |                        |
|  2 |    PX SEND QC (RANDOM) | :TQ10000 |       1 | 31331 |           |        |     4 |          |      |       |          |                        |
|  3 |     PX BLOCK ITERATOR  |          |       1 | 31331 |           |        |     4 |          |      |       |          |                        |
|  4 |      TABLE ACCESS FULL | TAB100M  |       1 | 31331 |        29 |     +2 |    53 |        0 | 7864 |   8GB |   100.00 | Cpu (9)                |
|    |                        |          |         |       |           |        |       |          |      |       |          | direct path read (104) |
=======================================================================================================================================================
I'll spare you DOP 8 and 16.
At this stage, it's totally obvious that the read throughput of the single SSD drive is the limiting factor, and that drive needs roughly 30s to deliver 8 Gb to the database processes—period. Therefore, the read throughput metric should be the same for all the above test runs.
Now let's see how things look in the Real Time SQL Monitor in SQL Developer.
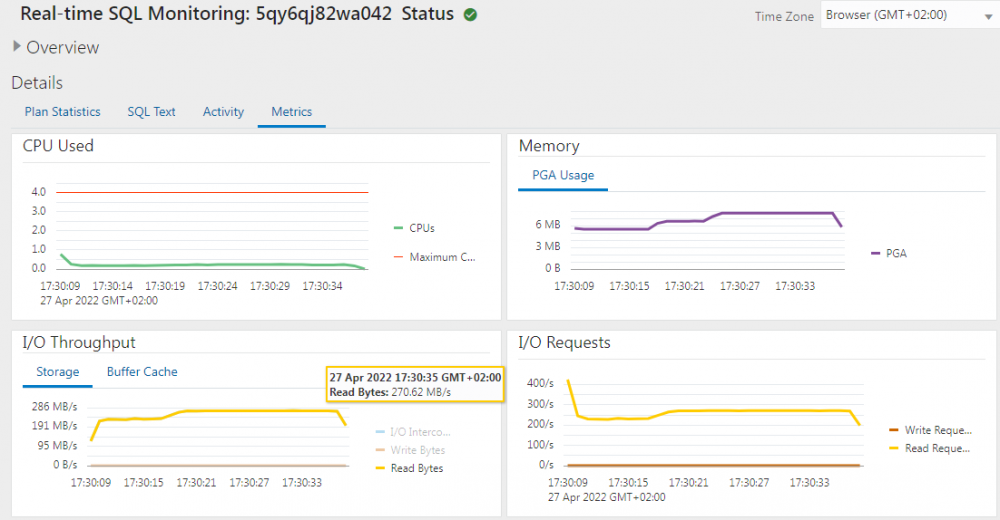
First the query without parallelism:
If you can read the figures—unfortunately, font size is very, very small in that display—you'll see that we got the expected throughput of 270 Mb/s.
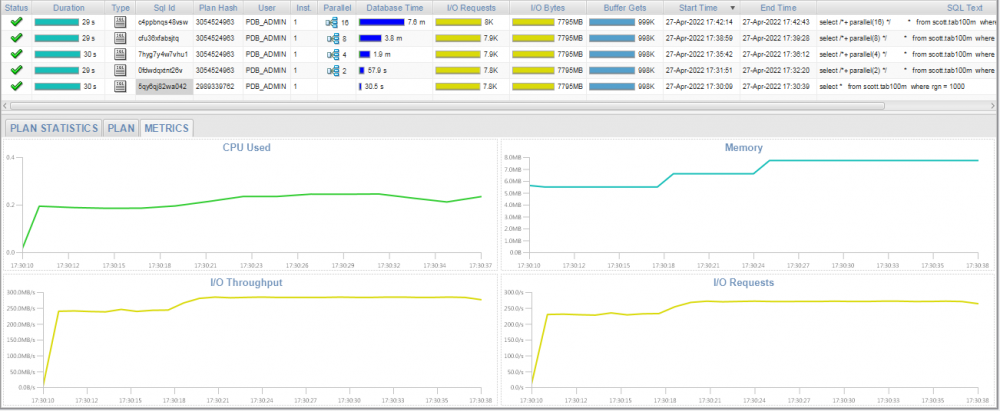
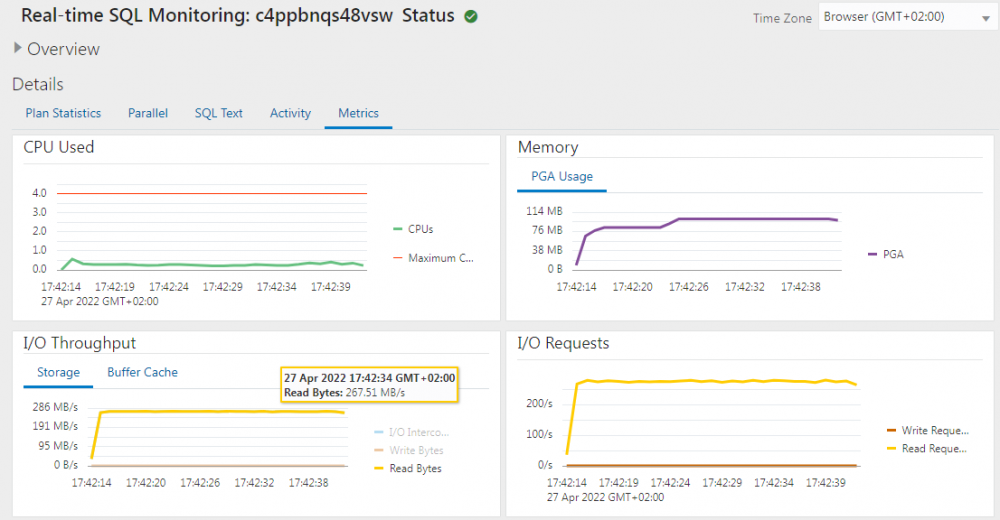
Now the test query with DOP 2:
Surprise! Read throughput appears to have dropped to 140 Mb/s, how is that possible?
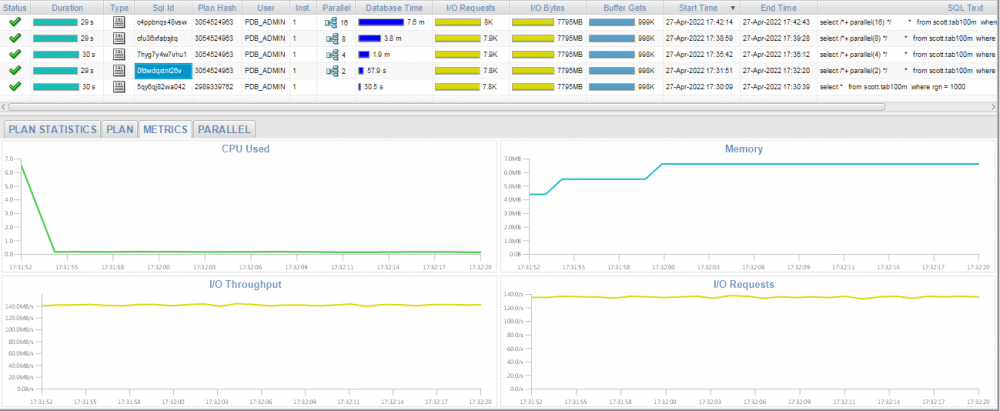
Same query at DOP 4:
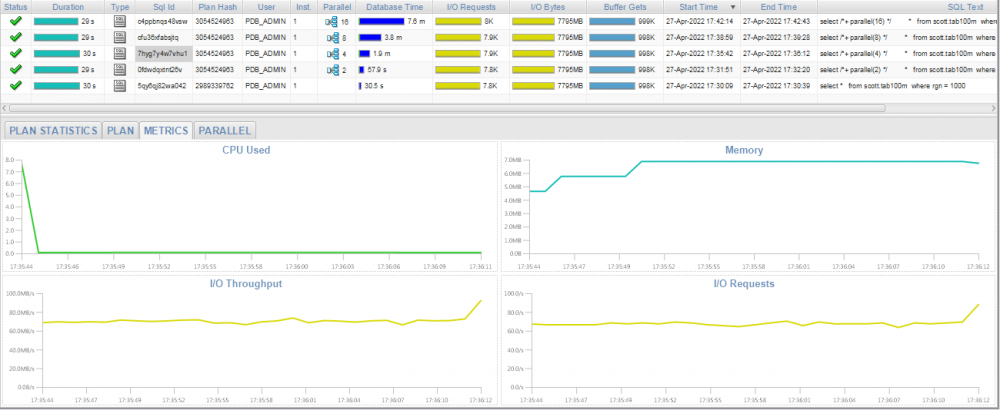
Read throughput at DOP 4 is now 70 Mb/s—can you see a pattern here?
Jumping to DOP 16:
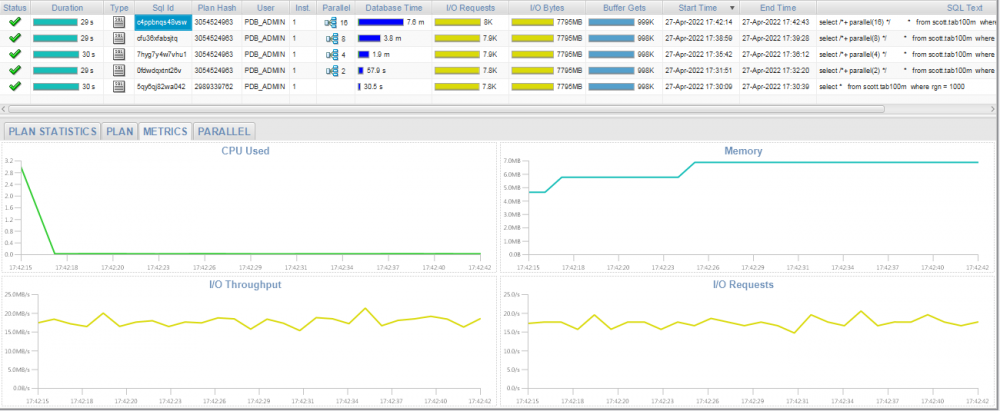
But in reality, the read throughput should very similar for the 5 test queries, as it should cumulative over all the participating parallel query processes, and in the end it's the read throughput of the single SSD drive which matters here.
If we generate the corresponding SQL Monitoring reports in Active format, here's how the metrics section of the reports look:
For the serial query:
For the parallel query at DOP 16:
Here the read throughput appears to be in the same ballpark for both queries. On the other hand, the PGA Usage of the parallel query is significantly higher. But again, the value shown in the active report (101 Mb) is far higher than that (7 Mb) reported by SQL Developer.
Cause: as always, the Statements tab on the Statements -> Log panel in SQL Developer makes it easy to spot a possible cause for this issue: apparently metrics are computed directly from ASH, using the following queries (formatted for clarity):
select /*+NO_MONITOR*/
    sample_time,
    tm_delta_cpu_time / tm_delta_time   as delta_cpu_time_prop
from
    v$active_session_history
where
    tm_delta_time is not null
    and sql_id = :sqlId
    and sql_exec_id = :sqlExecId
    and sql_exec_start = :sqlExecStart
And:
select /*+NO_MONITOR*/
    sample_time,
    delta_time,
    1000000 * delta_read_io_requests / delta_time      as read_io_request_rate,
    1000000 * delta_write_io_requests / delta_time     as write_io_request_rate,
    1000000 * delta_read_io_bytes / delta_time         as read_io_byte_rate,
    1000000 * delta_write_io_bytes / delta_time        as write_io_byte_rate,
    1000000 * delta_interconnect_io_bytes / delta_time as interconnect_io_byte_rate,
    0                                                  as mem_byte_rate,
    pga_allocated                                      as pga,
    temp_space_allocated                               as temp_space
from
    v$active_session_history
where
    sql_id = :sqlId
    and sql_exec_id = :sqlExecId
    and sql_exec_start = :sqlexecstart
Obviously, neither query contains a GROUP BY clause. Which means that aggregating is either done by the client, or not at all—as it would seem.
Just thought I'd mention it.
Regards,