Question1.
In the OEM ASH Analytics page, what does Y axis represent ? i.e, the one with values 18.5, 37.0.
To view the zoomed version of the below screenshots in Chrome browser, Right click > Open image in new tab
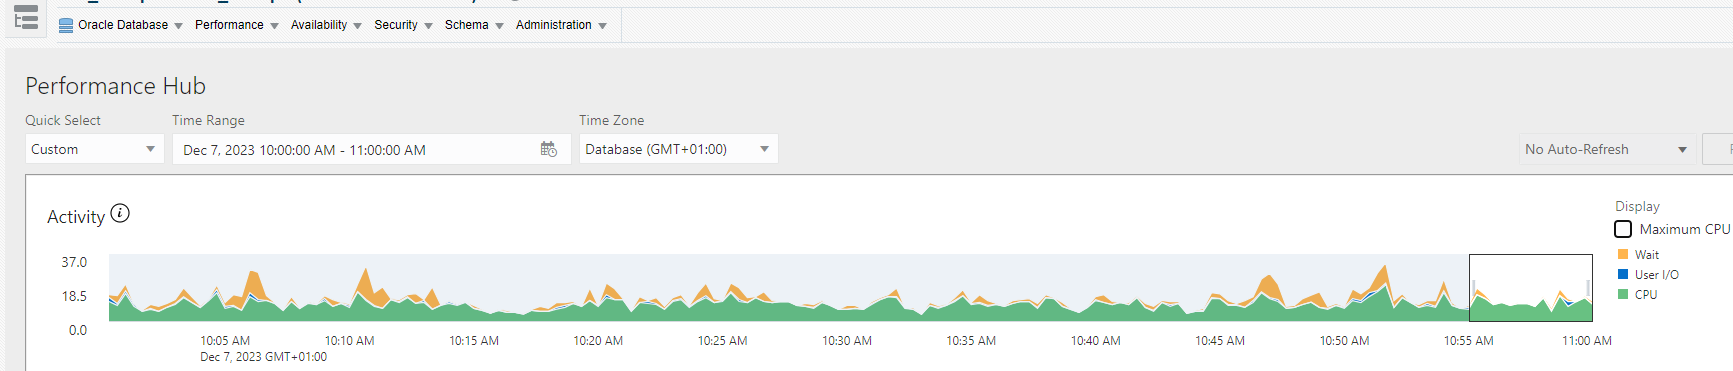
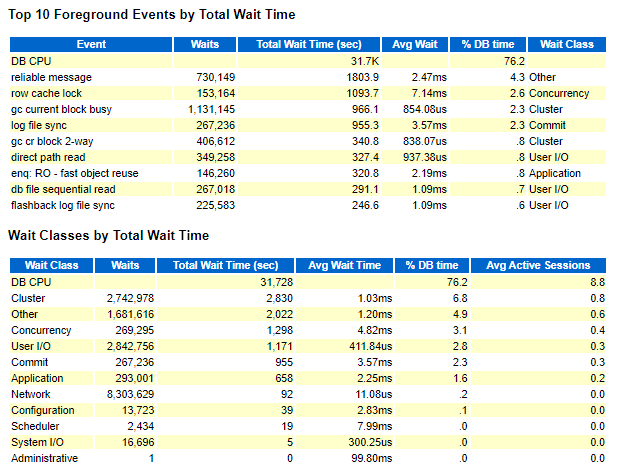
Question2. As shown above (in the graph), the during peak hours, I always see green i.e, Sessions waiting for CPU.
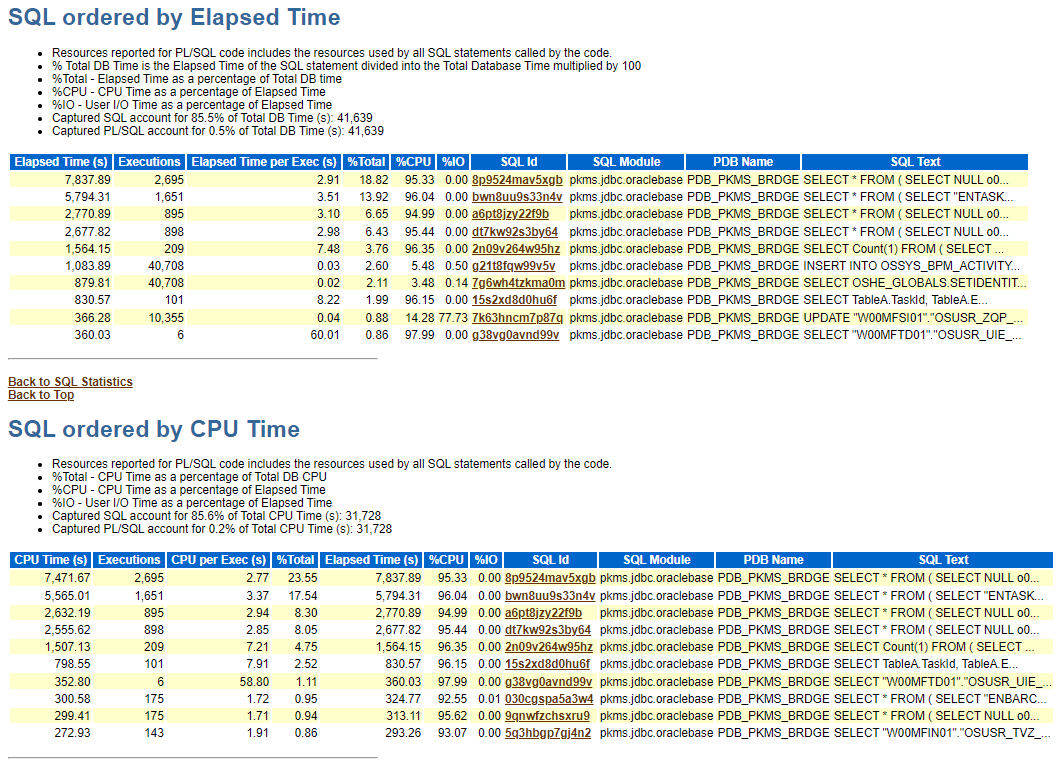
Query with SQL_ID 8p9524mav5xgb is doing a Full table scan on a 1.2 GB table. I am going to create an index to fix this.
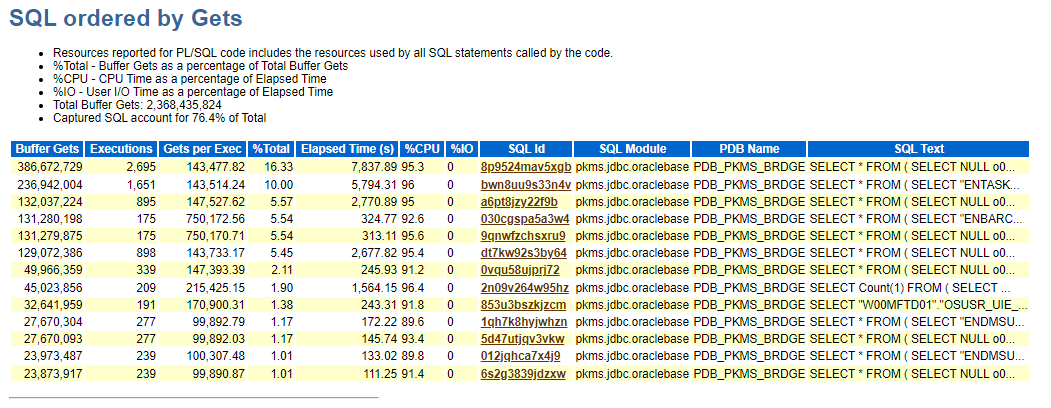
Following is what I found by googling on What "Buffer gets" means :
"When Oracle requires a data block, it first checks to see if this data block is already in memory (database buffer cache). If the data block is found there, Oracle will read it. This process is called as ‘buffer get’. If the data block is not found, Oracle will need to bring the data block from disk into buffer cache first. This process is called as ‘disk read’. From Oracle database’s standpoint, the ‘buffer get’ is ‘logical I/O’, while ‘disk read’ is ‘physical I/O’. A buffer get may or may not require a disk read."
Is it accurate to conclude that all that Green for CPU I see in the ASH Analytics is for Buffer gets.
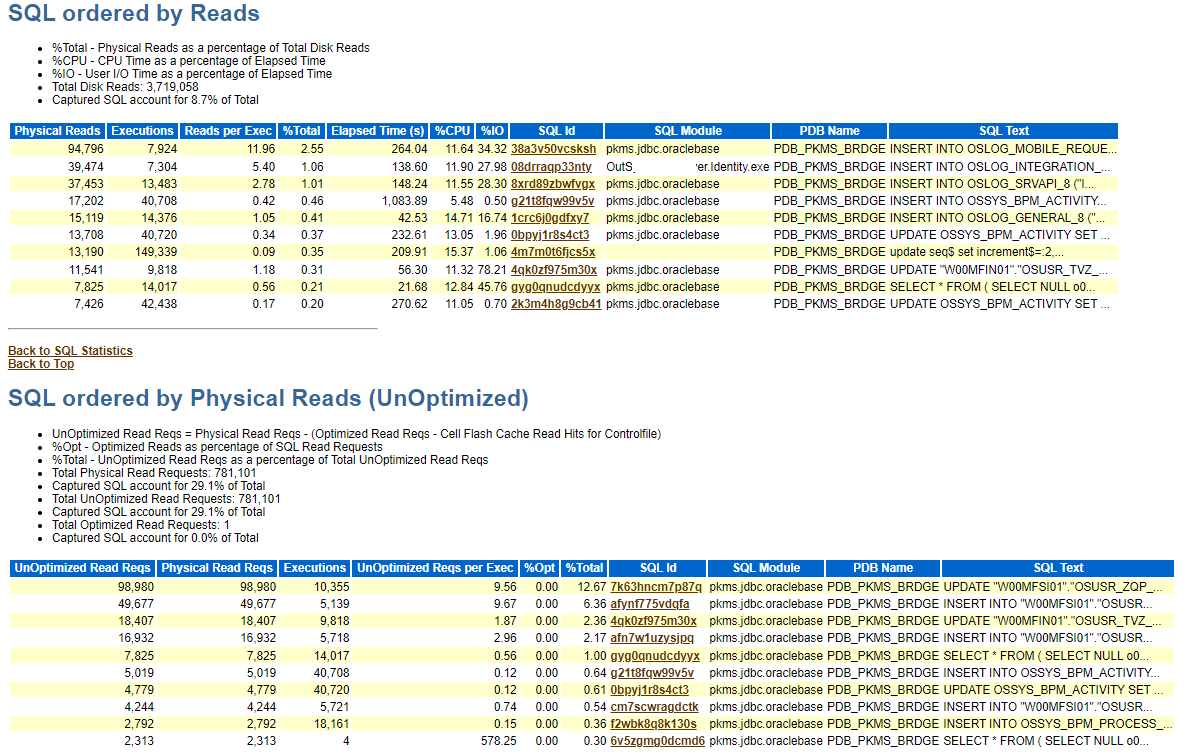
Question3. In "SQL ordered by Gets"'s **%IO** column shows 0. Does this mean all the SQLs listed under "SQL ordered by Gets" got it what it wanted from the DB Buffer cache and hence it wasn't so expensive as Disk I/O ?
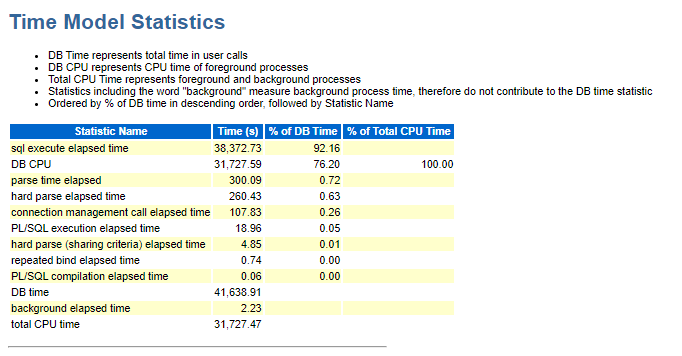
Question4. Any other relevant info in the AWR data provided below ?