We're experiencing an issue where it seems that the query plan changes from day to day for a particular procedure that runs once a night. I believe I've pinpointed the query that's causing the problem below. It's resulting in a performance variance of 10 second completion time vs 20 minutes (nothing in between). It started occurring about 2 months ago and now it's becoming more prevalent where the bad query plan is coming up more often.We didn't introduce any code changes and nothing looks fishy with the data.
I took two database saveoffs and noticed that the query plans vary for a simple query. We do run gather statistics every night. (DBMS_STATS.GATHER_SCHEMA_STATS (ownname=>sys_context( 'userenv', 'current_schema' ), estimate_percent => 1);)
In my testing, I also ran statistics every single time before doing the query plan and the query plans remain consistent for each database (they differ from each other).
Any idea what the problem is for me?
"Bad Database"
1a) Record count from query
select count(*) from cs_bucket_member_v2 where bucket_type='P' and sec_id > 0 and order_id=0
-- query returns 1405695
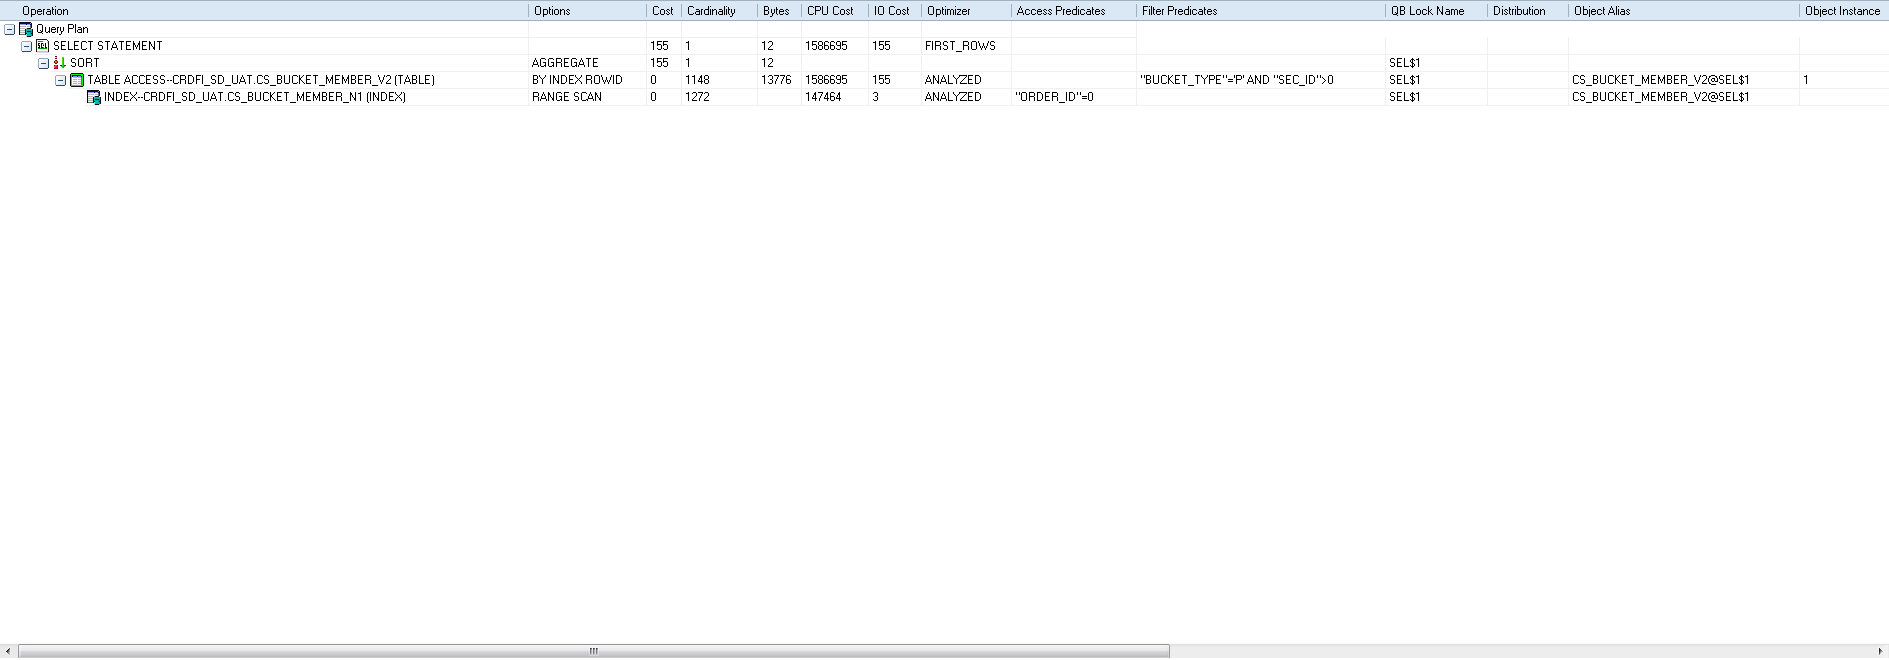
1b) Query plan in DB that runs too long. Notice row count is smaller than expected.(1148 rows in the plan whereas the query itself returns 1.4 million records)
PLAN_TABLE_OUTPUT
----------------------------------------------------------------------------------------------------
Plan hash value: 2027833486
----------------------------------------------------------------------------------------------------
| Id | Operation | Name | Rows | Bytes | Cost (%CPU)| Time |
----------------------------------------------------------------------------------------------------
| 0 | SELECT STATEMENT | | 1 | 12 | 155 (0)| 00:00:02 |
| 1 | SORT AGGREGATE | | 1 | 12 | | |
|* 2 | TABLE ACCESS BY INDEX ROWID| CS_BUCKET_MEMBER_V2 | 1148 | 13776 | 155 (0)| 00:00:02 |
|* 3 | INDEX RANGE SCAN | CS_BUCKET_MEMBER_N1 | 1272 | | 3 (0)| 00:00:01 |
----------------------------------------------------------------------------------------------------
PLAN_TABLE_OUTPUT
----------------------------------------------------------------------------------------------------
Predicate Information (identified by operation id):
---------------------------------------------------
2 - filter("BUCKET_TYPE"='P' AND "SEC_ID">0)
3 - access("ORDER_ID"=0)
"Good database"
2a) Record count from query
select count(*) from cs_bucket_member_v2 where bucket_type='P' and sec_id > 0 and order_id=0
-- query returns 1614191
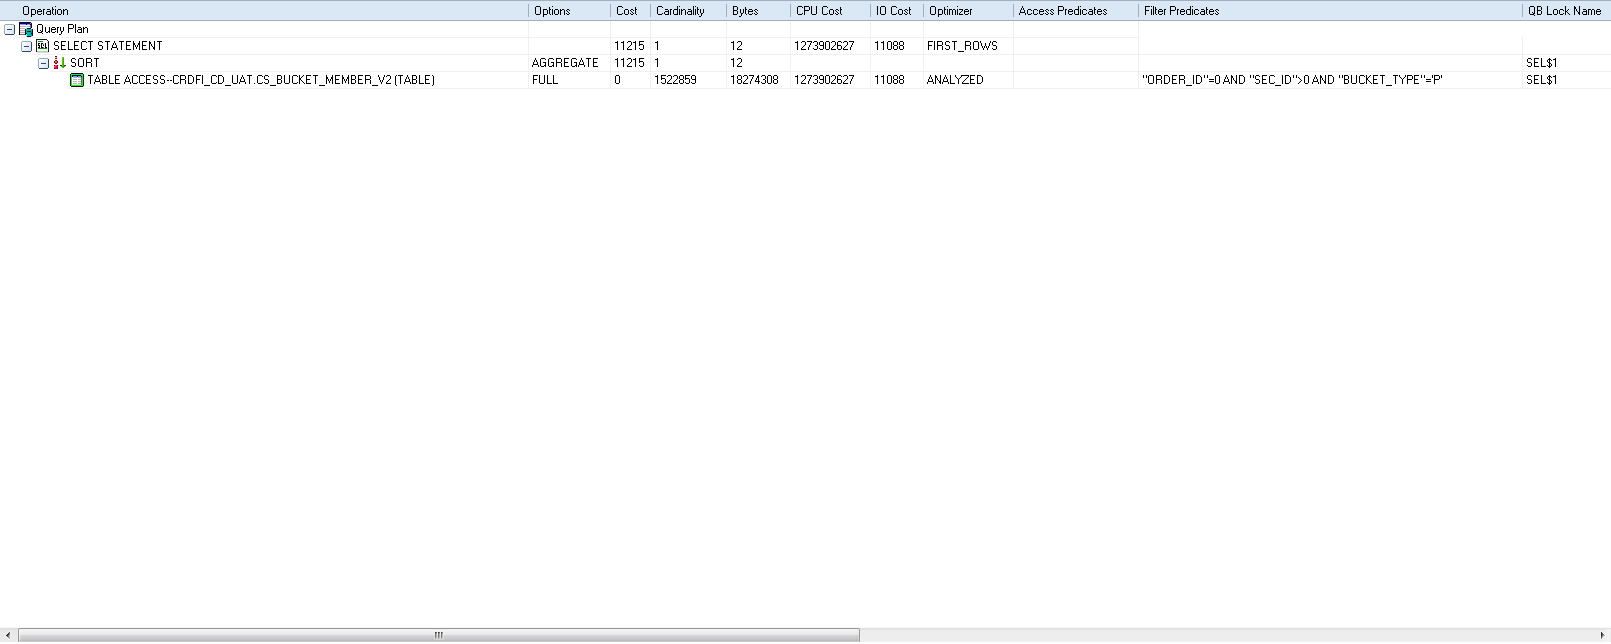
2b) Query plan in DB that runs efficiently and quickly. Good plan. Notice row count is about correct (1.5 million in plan vs 1.6 million from query result)
SQL> SELECT PLAN_TABLE_OUTPUT FROM TABLE(DBMS_XPLAN.DISPLAY());
PLAN_TABLE_OUTPUT
-------------------------------------------------------------------------------------------
Plan hash value: 3596429027
------------------------------------------------------------------------------------------
| Id | Operation | Name | Rows | Bytes | Cost (%CPU)| Time |
------------------------------------------------------------------------------------------
| 0 | SELECT STATEMENT | | 1 | 12 | 11215 (2)| 00:01:41 |
| 1 | SORT AGGREGATE | | 1 | 12 | | |
|* 2 | TABLE ACCESS FULL| CS_BUCKET_MEMBER_V2 | 1522K| 17M| 11215 (2)| 00:01:41 |
------------------------------------------------------------------------------------------
Predicate Information (identified by operation id):
PLAN_TABLE_OUTPUT
-------------------------------------------------------------------------------------------
---------------------------------------------------
2 - filter("ORDER_ID"=0 AND "SEC_ID">0 AND "BUCKET_TYPE"='P')
14 rows selected.