Hi All,
In Apex 21.2
Having this chart:
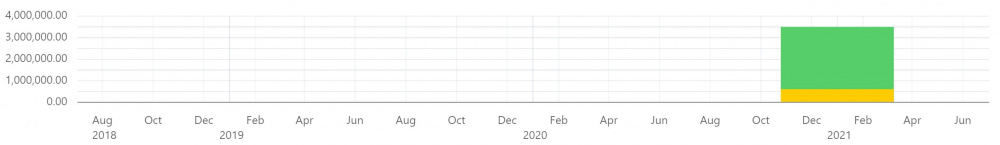 Am trying to group by the last 5 years. The problem is that is also showing the months. Something also shows the dates and hours instead of the year and months. How can I restrict it to show only the years in the X axis?
Also, I would like the series bar not stack but besides each one. What is the property I need to change?
This is the query am using in the series:
select null,
sum(f.prima) value,
to_char( EXTRACT (YEAR FROM f.efectiva)) label
from risk_facturas f, risk_polizas p
where p.poliza_id = f.poliza_id
and f.efectiva between trunc(ADD_MONTHS(sysdate,-60),'YEAR') and add_months(trunc(sysdate, 'y'), 12) - 1
and p.cliente_id = :P32_CLIENTE_ID
and f.organizacion_id = :APP_GET_ORGANIZACION_ID
group by to_char( EXTRACT (YEAR FROM f.efectiva))
Thanks for the help!