For appeals, questions and feedback about Oracle Forums, please email oracle-forums-moderators_us@oracle.com. Technical questions should be asked in the appropriate category. Thank you!
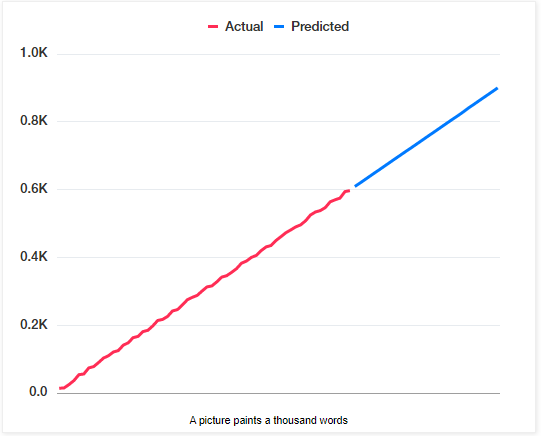
want to use line chart use a same data series and display in different colours for example from past dates to current date in blue colour andfrom current date to future dates in orange? the date is in x axis and value in y axis something like this..