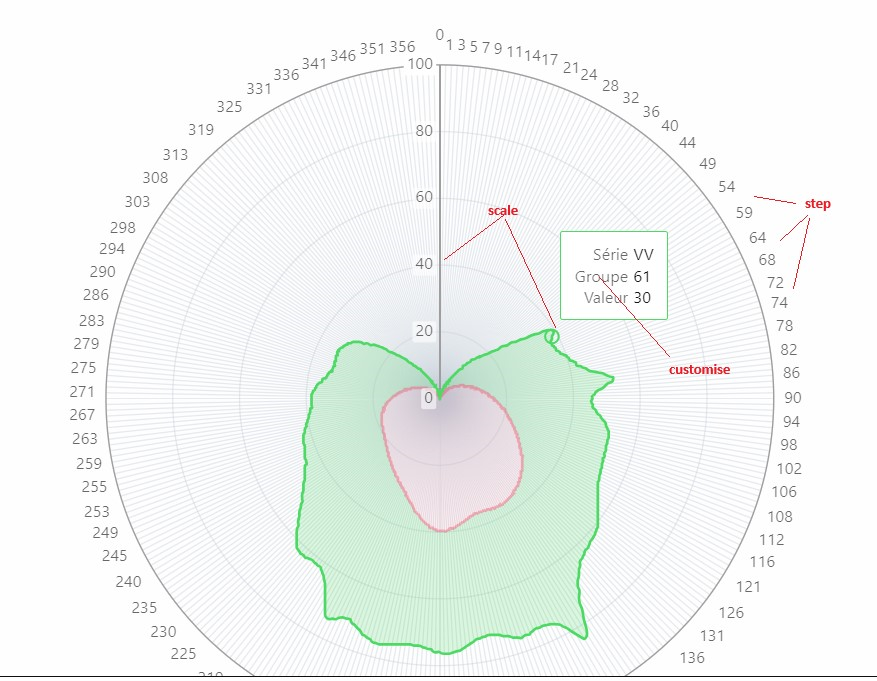
I created a polar chart. However, I found few issues that hopefully someone could help ( hopefully also would be beneficial for others ) :
1. step
I dont't understand why the step is not regular. For exemple, 5 ( 54 - 59 ), 4 ( 64 - 68 ), or 2 ( 72 - 74 ). How can I set a fix step, say 10 ?
2. customise the tooltip
The lables for the tooltip are 'Series', 'Groupe', and 'Valeur'. Where can I customise them ?
3. scale
The value on the tooltip says it's 30, but on the vertical axis, it's close to 40. The vertical axis is from 0 to 100 with 20 as step. I checked againt the table, that the 'Groupe 61' has the correct value '30'. It's just that the mapping against that vertical axis is wrong. Any idea why is wrong ?

Thanks for any help.