I'm looking for some custom XML to plot a cumulative frequency chart of count vs date where the dates are not evenly spread using the AnyChart component in APEX. I assume that a scatter chart is the best option here with the date on the X axis and the count on the Y axis. The small portion of the data that I have looks like this
LINK LABEL X_VALUE Y_VALUE
XX 18/11/2002 09:23 1
AF 25/04/2003 14:40 2
ZA 25/04/2003 14:40 3
AL 25/04/2003 14:40 4
DZ 25/04/2003 14:40 5
DE 25/04/2003 14:40 6
AD 25/04/2003 14:40 7
AO 25/04/2003 14:40 8
AI 25/04/2003 14:40 9
and can be created with this
Insert into EXPORT_TABLE (LINK,LABEL,X_VALUE,Y_VALUE) values (null,'XX','09:23:26 18/11/2002',1);
Insert into EXPORT_TABLE (LINK,LABEL,X_VALUE,Y_VALUE) values (null,'AF','14:40:54 25/04/2003',2);
Insert into EXPORT_TABLE (LINK,LABEL,X_VALUE,Y_VALUE) values (null,'ZA','14:40:55 25/04/2003',3);
Insert into EXPORT_TABLE (LINK,LABEL,X_VALUE,Y_VALUE) values (null,'AL','14:40:55 25/04/2003',4);
Insert into EXPORT_TABLE (LINK,LABEL,X_VALUE,Y_VALUE) values (null,'DZ','14:40:55 25/04/2003',5);
Insert into EXPORT_TABLE (LINK,LABEL,X_VALUE,Y_VALUE) values (null,'DE','14:40:56 25/04/2003',6);
Insert into EXPORT_TABLE (LINK,LABEL,X_VALUE,Y_VALUE) values (null,'AD','14:40:56 25/04/2003',7);
Insert into EXPORT_TABLE (LINK,LABEL,X_VALUE,Y_VALUE) values (null,'AO','14:40:57 25/04/2003',8);
Insert into EXPORT_TABLE (LINK,LABEL,X_VALUE,Y_VALUE) values (null,'AI','14:40:57 25/04/2003',9);
I've played with changing various parameters in the XML generated for a simpler number vs number scatter plot but can not get a chart with a date X axis to render at all.
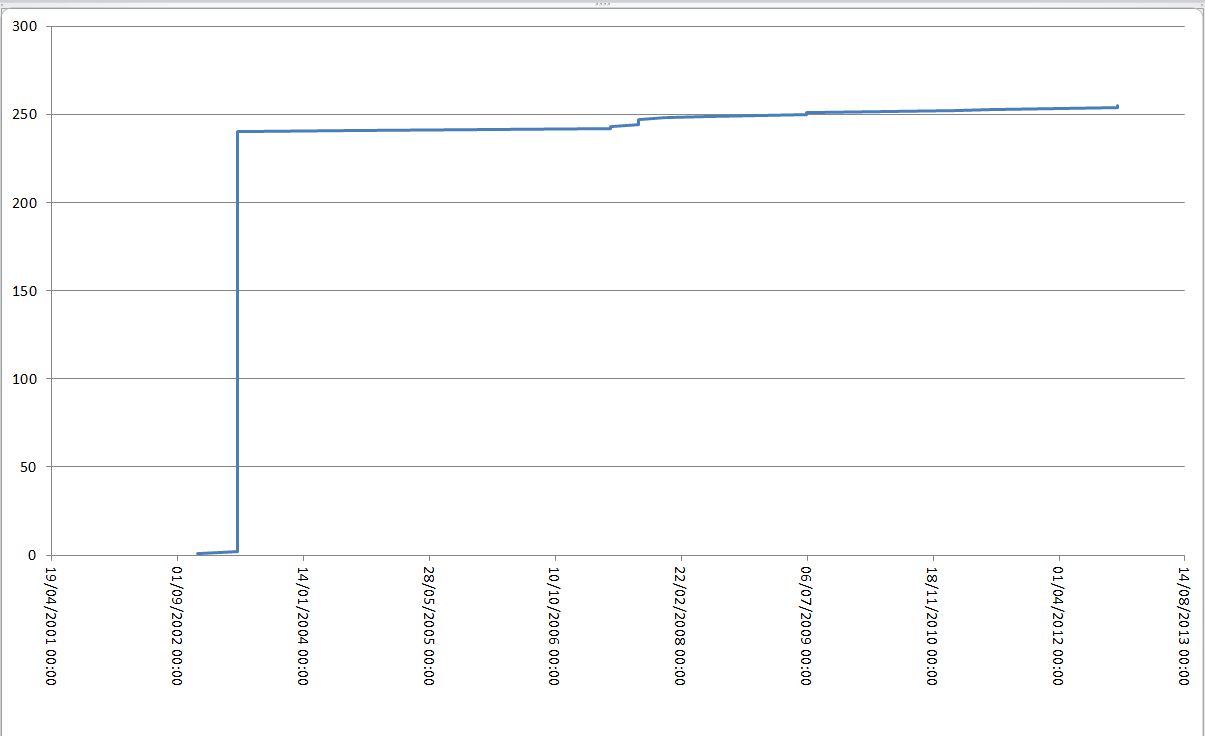
It should look something like this (created in Excel).
I am running APEX 4.1.1.00.2.
Thanks in advance.