Hi,
I have created a pie chart and have the legend set to the end, using the legend.position tab on my pie chart. My issue is that some of the series names are getting cut off.
For example:
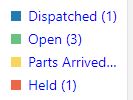
I've read the documentation, namely https://www.oracle.com/webfolder/technetwork/jet/jsdocs/oj.ojChart.html#legend.position . I was able to change the color to blue as shown above by using legend.text-style. I tried to add other style class type items to legend.text-style but the only one it seems to pickup is the color.
self.legendStyle = { "word-wrap": "break-word", "color": "blue" };
HTML:
      \<oj-chart id="pieChart" type="pie" data="\[\[dataProvider\]\]" animation-on-display="auto"

        selection="{{pieChartSelectValue}}" selection-mode="single"

        style-defaults.selection-effect="highlightAndExplode" animation-on-data-change="auto"

        pie-center.label="Assigned Calls" legend.position="end" legend.series-section.title-style="\[\[legendStyle\]\]" legend.text-style="\[\[legendStyle\]\]"

        pie-center.label-style={"fontSize":"14px","color":"#999999","font-weight":"bold"}

        style-defaults.pie-inner-radius="0.5" hover-behavior="dim" on-selection-changed="\[\[pieSelected\]\]">

        \<template slot='itemTemplate' data-oj-as='item'>

          \<oj-chart-item value='\[\[item.data.value\]\]' group-id='\[\[ \[item.data.group\] \]\]'

            series-id='\[\[item.data.series\]\]'>

          \</oj-chart-item>

        \</template>

      \</oj-chart>
Is there anyway I can set this somehow? I also tried reducing the font-size above but it doesnt seem to take.
Also, is there a way to display the value on the pie chart, instead of the percent?
For example, if I had 4 values, 2, 2, 2, 2 I would prefer the pie slices just said "2" instead of 25%?
Thanks!