Hi All,
I have problem with PARALLEL query used in Batch processing, the query was written long back, I just came to know the batch taking longer time to complete.
We got AWR report, in TOP SQL Statement, there was query with Parallel hint causing issue.
Below is the query from AWR Report.
Finding 1: Top SQL Statements
Impact is 2.46 active sessions, 54.03% of total activity.
---------------------------------------------------------
SQL statements consuming significant database time were found. These
statements offer a good opportunity for performance improvement.
Recommendation 1: SQL Tuning
Estimated benefit is 2.32 active sessions, 50.9% of total activity.
Action
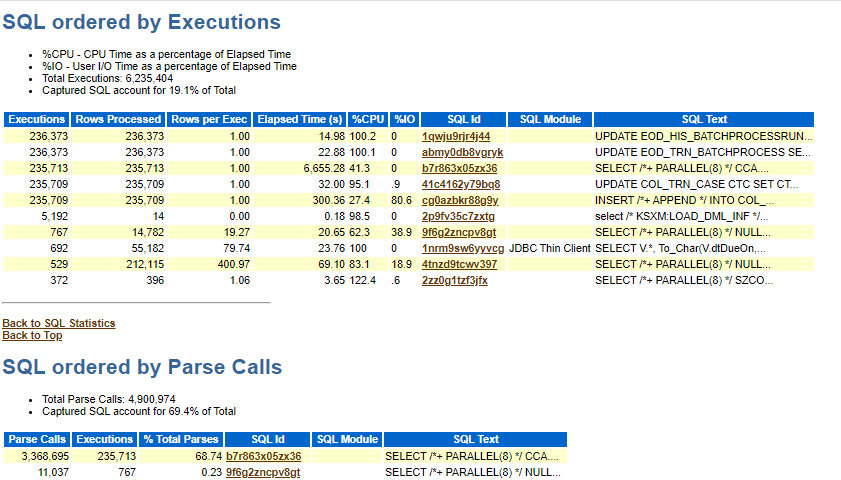
  Investigate the SELECT statement with SQL\_ID "b7r863x05zx36" for

  possible performance improvements. You can supplement the information

  given here with an ASH report for this SQL\_ID.

  Related Object

     SQL statement with SQL\_ID b7r863x05zx36.

     SELECT /\*+ PARALLEL(8) \*/ CCA.SZCOLLECTORCODE, NVL(CTC.FFIELD4, 0)

     FFIELD4, CTC.DTFIELD1, NVL(CTC.FFIELD3, 0) FFIELD3, CTC.IFIELD1

     IFIELD1, CCA.IALLOCSEQNO, CTC.ICASESEQNO, CCA.SZWFCODE,

     CCA.SZWFSTATECODE, CCA.SZCOLLECTORGRPCODE, CCA.DTWFDATE,

     CCA.DTWFSTATEDATE, CCA.DTCOLLECTORGRPDATE, CCA.DTASSIGNED,

     CTC.DTFIELD2, CTC.SZFIELD6, CTC.SZFIELD5, CTC.DTFIELD3 DTFIELD3,

     CTC.IFIELD2 IFIELD2, CTC.FFIELD5 FFIELD5, CTC.FFIELD6 FFIELD6,

     CTC.DTFIELD4 DTFIELD4, CTC.DTFIELD6 FROM COL\_CUR\_AGREEMENTALLOC CCA,

     COL\_TRN\_CASE CTC WHERE CTC.ICASESEQNO = CCA.ICASESEQNO AND

     CTC.IAGREEMENTSEQNO = :B2 AND CTC.ICASESEQNO = :B1
Rationale
  The SQL spent only 25% of its database time on CPU, I/O and Cluster

  waits. Therefore, the SQL Tuning Advisor is not applicable in this case.

  Look at performance data for the SQL to find potential improvements.
Rationale
  Database time for this SQL was divided as follows: 98% for SQL

  execution, 2% for parsing, 0% for PL/SQL execution and 0% for Java

  execution.
Rationale
  SQL statement with SQL\_ID "b7r863x05zx36" was executed 235713 times and

  had an average elapsed time of 0.028 seconds.
Rationale
At least one execution of the statement ran in parallel.
Rationale
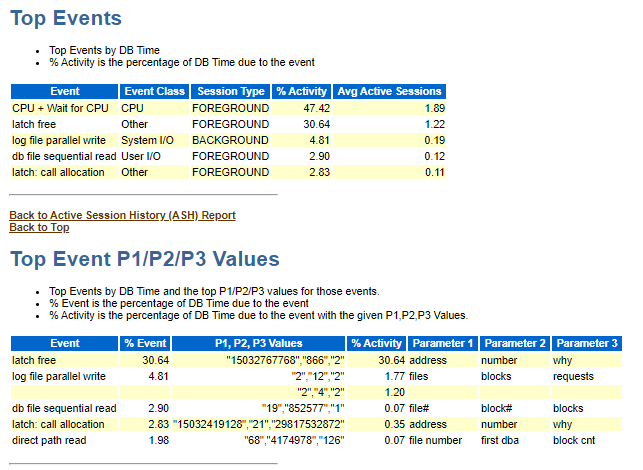
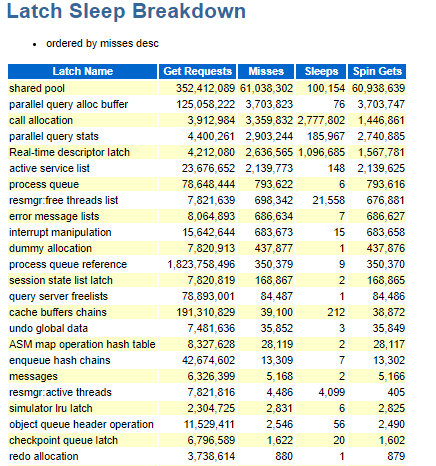
  Waiting for event "latch free" in wait class "Other" accounted for 66%

  of the database time spent in processing the SQL statement with SQL\_ID

  "b7r863x05zx36".
Rationale
  Waiting for event "PX Deq: Join ACK" in wait class "Other" accounted for

  4% of the database time spent in processing the SQL statement with

  SQL\_ID "b7r863x05zx36".
Please let me know if any other details required. I had no clue how to address this issue. Appreciate if anyone help me out of this.
Thanks in Advance.