Hi,
One of my APEX page started taking too long to load i.e around 2 mins.
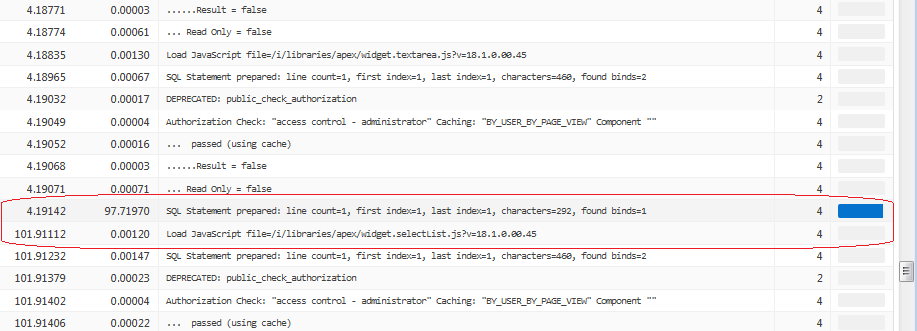
When I run page in Debug mode and try to analyze 'View Debug' logs -> 'Debug' tab, I can see message showing maximum execution time with corresponding 'Graph Column' in Full Blue color bar but I'm not able to map it to respective Page Item.
How can I map this to my Page Item which is taking maximum time ?