Hi,
I have Oracle 12.2 RAC(3 node) in AIX/Power-7 system, I have question on whether I am seeing the correct granule size as per my system configuration,
sga_max_size * 68719476736
sga_target * 68719476736
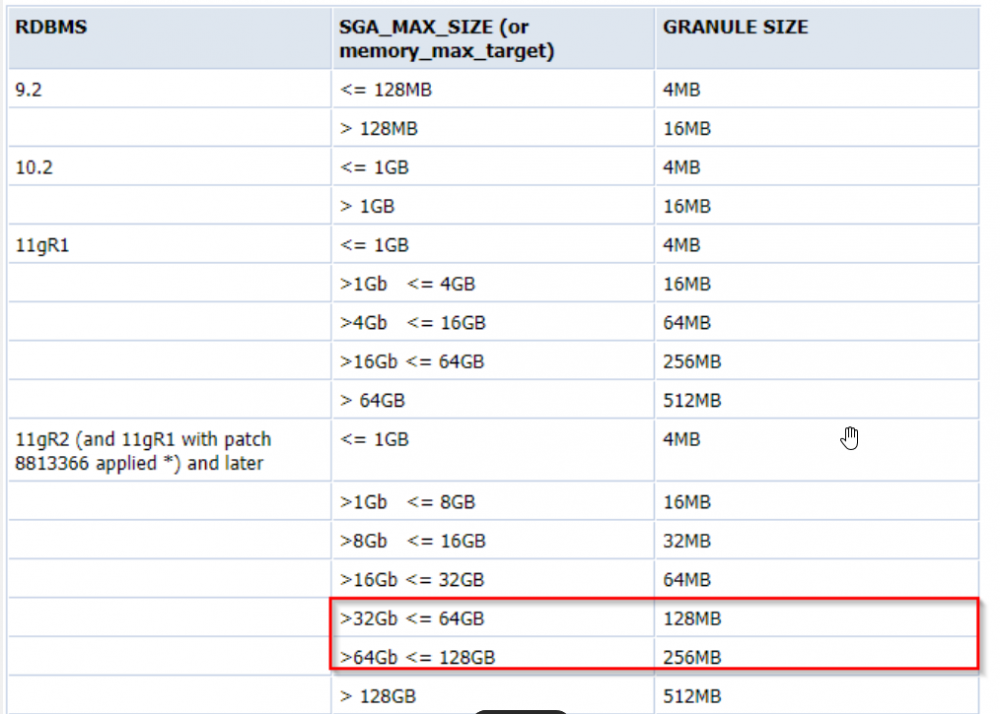
Since the SGA is set to 64GB , I am expecting the granule size to be reported as 128MB but actually reported by v$sgainfo as 134217728 (bytes) , I believe this is correct.
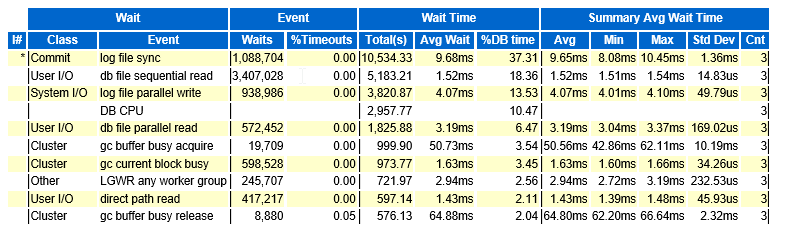
Based on gv$sysstat , I am seeing "redo log space requests" , and it seems significant.
The redo buffers is calculated as 112 MB as per v$sgainfo,
As per note : Tuning the Redolog Buffer Cache and Resolving Redo Latch Contention (Doc ID 147471.1),
The value of "redo log space requests" should be near 0. If this value increments consistently, processes have had to wait for space in the buffer. This may be caused the checkpointing or log switching. Improve thus the checkpointing or archiving process.
This system does about 600 commits per second,
Should I be increasing the sga_max_size/sga_target to a higher value so the granule size would jump to the next granule size, 256MB ?
I dont understand the reason for indicating "redo log space requests" , this system is under log file sync /log file parallel write pressure .. / the typical avg response time for log file sync is like 4 - 5 ms , on this day there were some SAN maintenance and the response time spiked. The system is very sensitive on the avg response time from SAN for redo logs.
SQL> l
 1 select * from gv$sysstat
 2*   where name= 'redo log space requests'
SQL> /

  INST_ID STATISTIC# NAME              CLASS   VALUE  STAT_ID   CON_ID
---------- ---------- ------------------------- ---------- ---------- ---------- ----------
     2    331 redo log space requests      2   39894 1985754937     3
     3    331 redo log space requests      2   40532 1985754937     3
     1    331 redo log space requests      2   38491 1985754937     3

SQL> select bytes from v$sgainfo where name like 'Granule Size';
BYTES
----------
134217728
SQL> select name,bytes/1024/1024,RESIZEABLE,CON_ID from v$sgainfo;

NAME BYTES/1024/1024 RES CON_ID
------------------------- --------------- --- ----------
Fixed SGA Size 15.2446899 No 0
Redo Buffers 112.753906 No 0
Buffer Cache Size 41728 Yes 0
In-Memory Area Size 0 No 0
Shared Pool Size 22784 Yes 0
Large Pool Size 512 Yes 0
Java Pool Size 384 Yes 0
Streams Pool Size 0 Yes 0
Shared IO Pool Size 512 Yes 0
Data Transfer Cache Size 0 Yes 0
Granule Size 128 No 0
Maximum SGA Size 65536 No 0
Startup overhead in Share 3841.97806 No 0
d Pool

Free SGA Memory Available 0 0
dlm_stats_collect * 0
audit_file_dest * /u03/oradata/psvrdb01/adump
audit_sys_operations * TRUE
audit_trail * XML, EXTENDED
background_dump_dest 1 /u03/oradata/psvrdb01/diag/rdbms/psvrdb01/trace

background_dump_dest
2 /u03/oradata/psvrdb01/diag/rdbms/psvrdb01/psvrdb01/trace

background_dump_dest
3 /u03/oradata/psvrdb01/diag/rdbms/psvrdb01/psvrdb01/trace
cluster_database * TRUE
compatible * 12.2.0.1.0
connection_brokers * ((TYPE=DEDICATED)(BROKERS=1)), ((TYPE=EMON)(BROKERS=1))
control_file_record_keep_time * 60
control_files * +DG_DATA_P01/psvrdb01/CONTROLFILE/current.277.998742251, +DG_FLSH_P01/psvrdb01/CONTROLFILE/current.265.998742253
cpu_count * 16
db_block_size * 8192
db_create_file_dest * +DG_DATA_DXX01
db_files * 1000
db_name * psvrdb01
db_recovery_file_dest * +DG_FLSH_P01
db_recovery_file_dest_size * 32212254720
deferred_segment_creation * FALSE
diagnostic_dest * /u03/oradata/psvrdb01
dispatchers * (PROTOCOL=TCP) (SERVICE=psvrdb01XDB)
dml_locks * 1000
enable_pluggable_database * TRUE
event * 10298 trace name context forever, level 32
global_names * TRUE
instance_number 1 1

instance_number
2 2

instance_number
3 3
java_pool_size * 268435456
job_queue_processes * 10
listener_networks *
local_listener 1 (ADDRESS=(PROTOCOL=TCP)(HOST=xxx.xxx.xxx.xxx)(PORT=1529))

local_listener
2 (ADDRESS=(PROTOCOL=TCP)(HOST=xxx.xxx.xxx.xxx)(PORT=1529))

local_listener
3 (ADDRESS=(PROTOCOL=TCP)(HOST=xxx.xxx.xxx.xxx)(PORT=1529))
log_archive_dest_1 * LOCATION=+DG_FLSH_DXX
log_archive_dest_2 *
log_archive_format * log%s_%t_%r.arc
log_checkpoint_interval * 1000000
memory_max_target * 0
memory_target * 0
nls_language * AMERICAN
nls_length_semantics * BYTE
nls_territory * AMERICA
open_cursors * 1500
optimizer_index_caching * 0
optimizer_index_cost_adj * 100
os_authent_prefix * OPS$
parallel_force_local * TRUE
pga_aggregate_limit * 6442450944
pga_aggregate_target * 3221225472
plsql_warnings * DISABLE:ALL
processes * 2000
remote_listener * <my-scan-addr>:1527
remote_login_passwordfile * EXCLUSIVE
resource_limit * TRUE
resource_manager_cpu_allocation * 80
resource_manager_plan * DEFAULT_CDB_PLAN
sec_max_failed_login_attempts * 10
sec_protocol_error_trace_action * LOG
session_cached_cursors * 150
sessions * 3024
sga_max_size * 68719476736
sga_target * 68719476736
sql92_security * TRUE
temp_undo_enabled * TRUE
thread 1 1

thread
2 2

thread
3 3
undo_retention * 14400
undo_tablespace 1 UNDOTBS1

undo_tablespace
2 UNDOTBS2

undo_tablespace
3 UNDOTBS3
user_dump_dest 1 /u03/db01/psvrdb01/trace

user_dump_dest
2 /u03/oradata/db01/psvrdb/diag/rdbms/psvrdb01/psvrdb01/trace

user_dump_dest
3 /u03/oradata/psvrdb/diag/rdbms/psvrdb01/psvrdb02/trace
Any feedback is appreciated.
Thanks!