Hi Experts,
I'm trying to create combination charts where the series name, labels and values should be dynamic. As an example, I have created simple scenario on apex.oracle.com. Below is how the data looks:
TABLE: ACTUAL_GROWTH
select
       FISCAL_YEAR,
       LOB,
       ACTUAL_GROWTH
from "ACTUAL_GROWTH" a

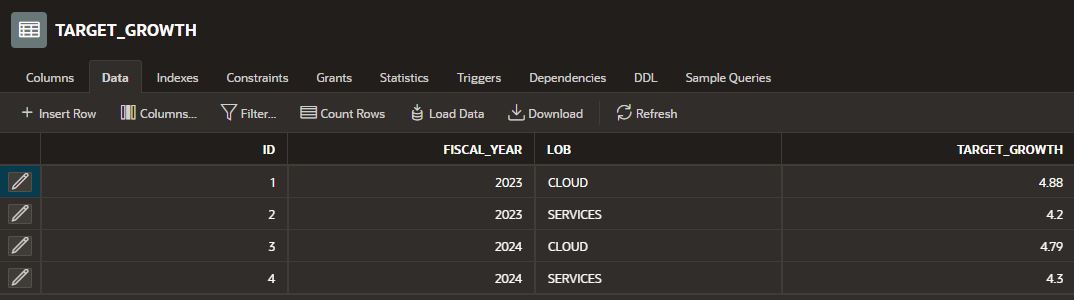
TABLE: TARGET_GROWTH
select
       FISCAL_YEAR,
       LOB,
       TARGET_GROWTH
from "TARGET_GROWTH" a
Below is the combination chart displaying as Group 3, 4 and 5

Here I'm trying to achieve legends = Series Name (Generate dynamically instead of creating each series with hardcoded value as the data keeps growing for different years)
x-Axis = LOB = Label
Y-Axis = GROWTH = Values
Below are the credentials to login to apex.oracle.com:
Workspace: DEMOJMJ
Username: demo
Password: Change@2023
Appreciate any help on this.
Thanks,
Vasanth