Oracle Apex 18
2021-05-17_15-04-32.zip (288.44 KB)I've uploaded a zip file, showing my bar chart behavior. I couldn't understand why the data looked strange, until I added a custom tooltip to show the values behind the data. As you can see as I scroll over, part of the data (order type1) seems to be working off one verion of the X axis , and the other part of the data is working off another version of the X axis.
But I only have one axis. And one query.
"Multi-Series Chart Data" is set to No.
My query is as attached.
query.txt (1.62 KB)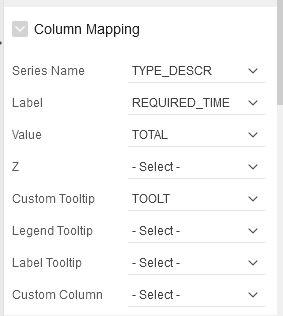 Any ideas?