Hello,
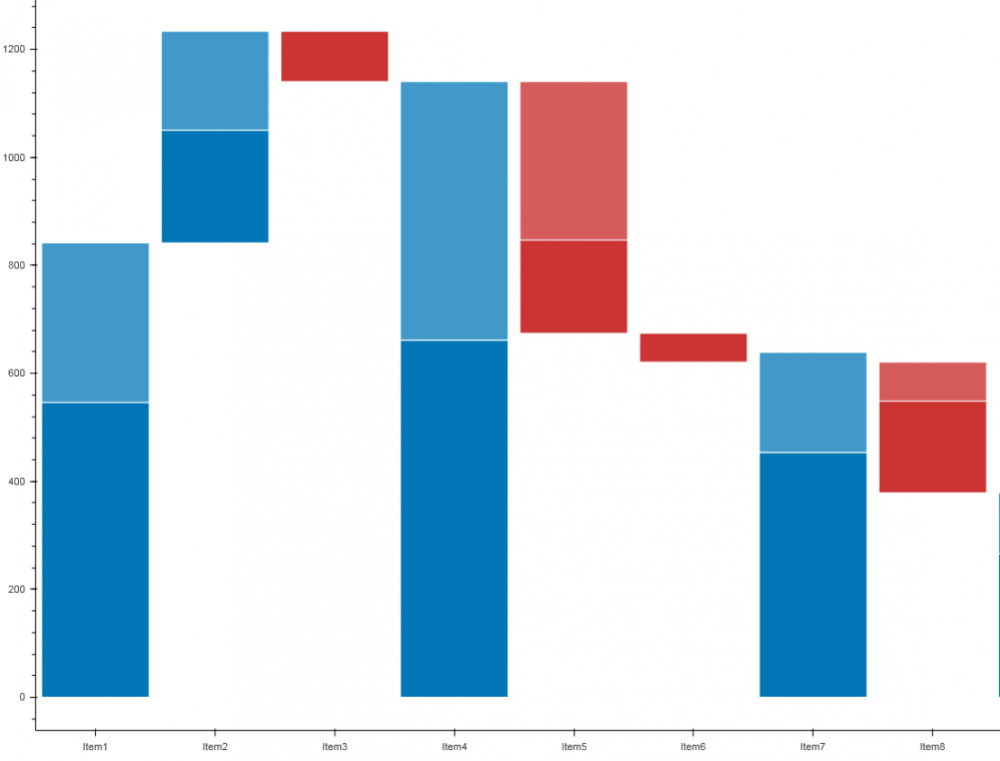
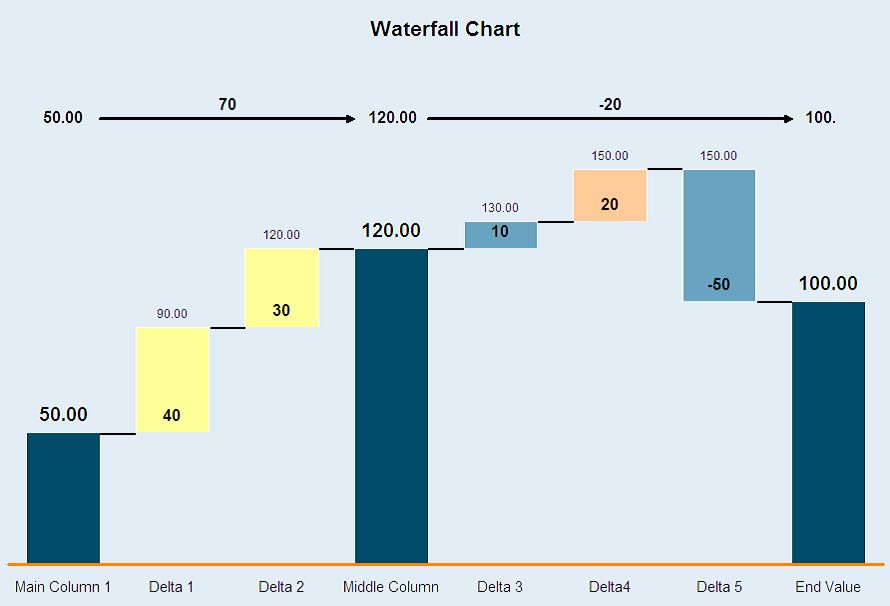
I am trying to create waterfall charts using Oracle Apex 20.1 with two series. One as a stack bar chart grouped by month and the second series for the increase resp. decrease of the values over the month. Please see the attached media for more details. In Oracle Apex 20.1 I didn't managed to combine the bar chart with a range bar. In the second series (i.e., range bar) the series isn't shown in the chart. Moreover, the increase resp. decrease should get its high from the previous sum value.
Any idea on how to get this done? Any help is appreciated.
Thank you.
Kind regards