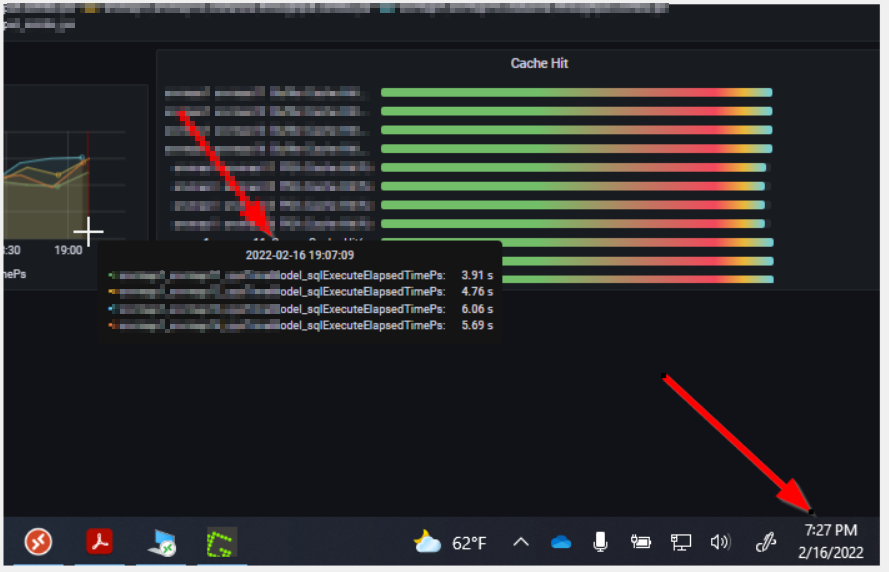
We have recently setup Grafana Dashboards using the OEM Application as the source. The sample dashboards are up and running. We would like to see the dashboard with close to realtime data as we are monitoring session counts and response times. Grafana is running about 10-15 minutes behind and I was curious if there would be a way to close this gap. I have increased the following properties.
# set from 20 to 60
emctl set property -name oracle.sysman.db.restfulapi.grafana.throttle.max.concurrent.request -value 60
# set from 30 to 120
emctl set property -name oracle.sysman.db.restfulapi.grafana.throttle.max.req.per.user -value 120
Anybody seeing similar and/or have any idea as to how and close this gap?