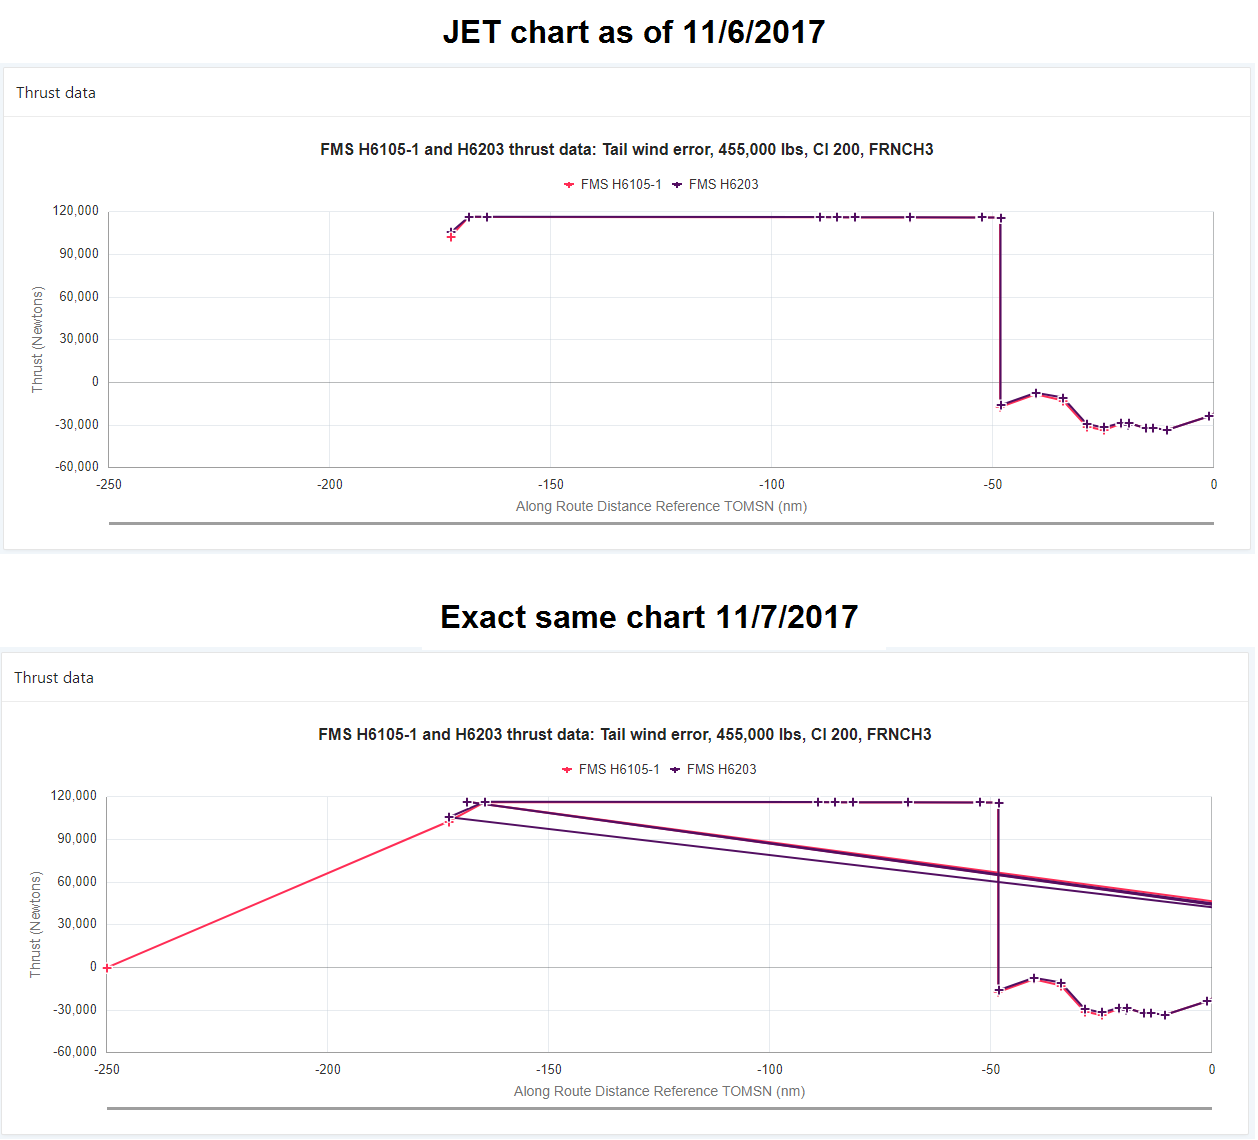
Most of my beautiful JET scatter charts have become ruined by the update to ApEx 5.1.3.00.05. Attached is an example. It looks like the JET chart algorithm is now including extraneous data points. It looks like the below from the release notes is the cause. Can I turn off this "support" feature that is injecting missing data points? What are some other options?
I really don't get the concept. Each series is supposed to have the same number of data points. Why? I am working with Scatter charts. Each series is a set of points. I simply want JET to put the points onto an XY grid and connect them in the order prescribed. Why would one series have to have the same number of points as another? How often would that even be the case? Even if so, the new algorithms in JET that are creating additional points are not working correctly for me. I have data sets that consist of only two data points, just to show a vertical line in the chart. But that has become two diagonal lines that connect to the left corner of the chart. Any help would be deeply appreciated.
Thanks.
Bill
Oracle Application Express 5.1.3 Known Issues
JET CHART DATA DENSIFICATION
Oracle JET requires that each series of a multi-series chart contains a data point for each label that is represented on the x-axis. Otherwise, the multi-series chart may not render correctly by Oracle JET. Prior to release 5.1.3, the user was required to handle the densification of their data in their chart SQL query to ensure that each series had the same number of data points, even if they were null or zero. Oracle Application Express release 5.1.3 now includes support to automatically fill in gaps, injecting missing data points for multi-series charts.