Problem Description:
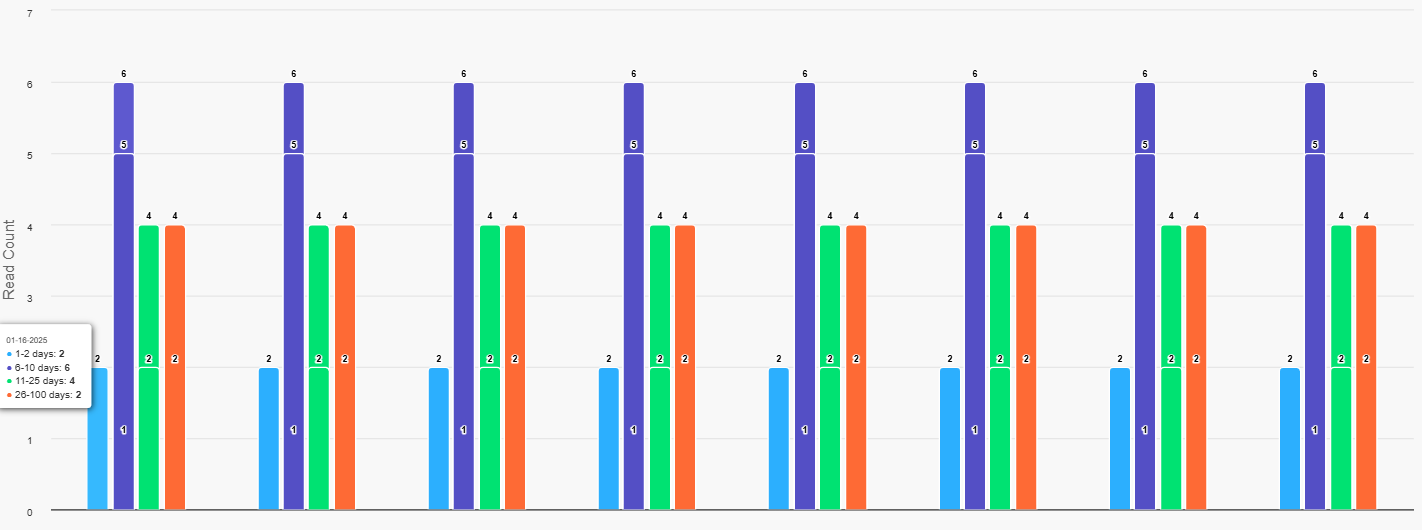
We are experiencing an issue in our Oracle APEX application where a bar chart created using ApexCharts is displaying multiple values within a single bar. This is not the expected behavior, as only one value should be shown per bar. The values seem to overlap or appear incorrectly within the same bar.
This issue is affecting the readability and overall appearance of the chart. We need assistance to either remove the overlapping values or confirm if this is the intended functionality of ApexCharts in Oracle APEX.
ChartType is column
Steps to Reproduce:
- Open the APEX application and navigate to the page containing the ApexCharts graph.
- Load the graph and observe the bars in the chart.
- In one or more bars, multiple values are displayed inside the bar, which is not intended.
- The data values should appear individually for each category without overlapping.
Expected Behavior:
Each bar in the ApexCharts graph should display only a single value corresponding to its category, without overlapping or showing multiple values in a single bar.
Actual Behavior:
Multiple values are appearing inside a single bar, which is causing confusion and making the chart harder to interpret.
Query:
Is this behavior expected by default in ApexCharts (i.e., displaying multiple values in a single bar), or is there a way to remove these multiple values from inside the bars? We are looking for a way to either adjust the chart configuration or disable this feature, as it is not providing the intended user experience.
Oracle APEX Version: 23.1.5
Chart Type: Column - Highchart plugin