Hi,
Hillary's chart sample app includes an examples of line charts and how to handle null values.
https://apex.oracle.com/pls/apex/f?p=36648:55
I've come across a scenario that goes a step further. If you have one series with a set of data points, and another overlapping series where some data points are missing, eg:
create table graph_lines (series number, thedate date, thevalue number);
insert into graph_lines
select 1 series
,add_months(trunc(sysdate,'yy'),rownum-1) thedate
,log(2,rownum) thevalue
from dual
connect by level <= 12
union all
select 2
,add_months(trunc(sysdate,'yy'),rownum-1)
,case when mod(rownum,3) =0 or rownum =2 then log(3,rownum) end
from dual
connect by level <= 12;
I get the case where it will plot a line between points that are next to each other, but where there are gaps it will just display the point
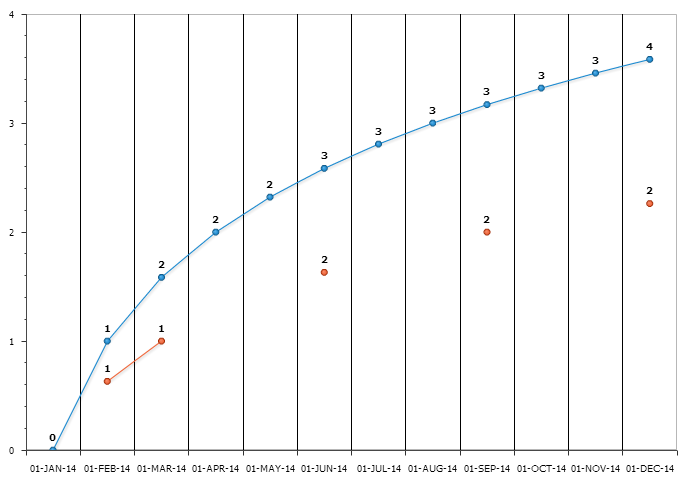
Image from https://apex.oracle.com/pls/apex/f?p=73000:35
I have no doubt this is expected behaviour, but I would like to know if anyone has ideas on how to connect the dots.
I figured a snazzy model clause the generates mid points in my data might work, but that sounds heavy handed, and a little scary.
I thought maybe there is a graphing solution?
APEX 4.2.x
Scott