How are the minimum and maximum whiskers calculated in Oracle Data Visualization?
I have always calculated the minimum whisker as the median - (1.5 * IQR) and the maximum as median + (1.5*IQR). The whiskers on the boxplot don't follow this method of calculating the min/max whiskers, and the visualization shows outliers that would fall within the whiskers if calculated with the conventional method?
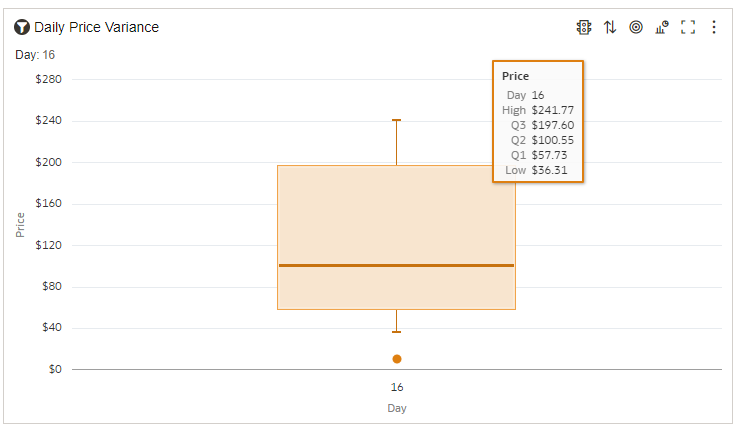
How can I get ODV to calculate the minimum and maximum whiskers with conventional method?
I'd greatly appreciate help on this visualization.