Hi Everyone,
I am trying to use pivot to get the results to show the way I want (shown at the bottom). I found this great video that explains it really well.
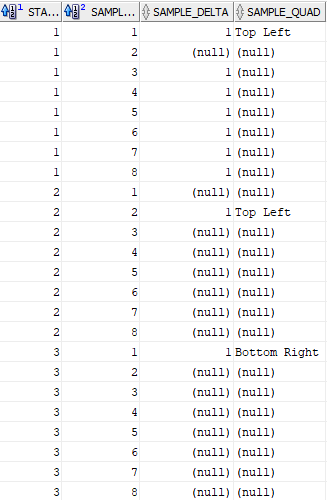
The difference in my case is one of the columns (SAMPLE_QUAD) is not a NUMBER column.
Here is a sample of my data:
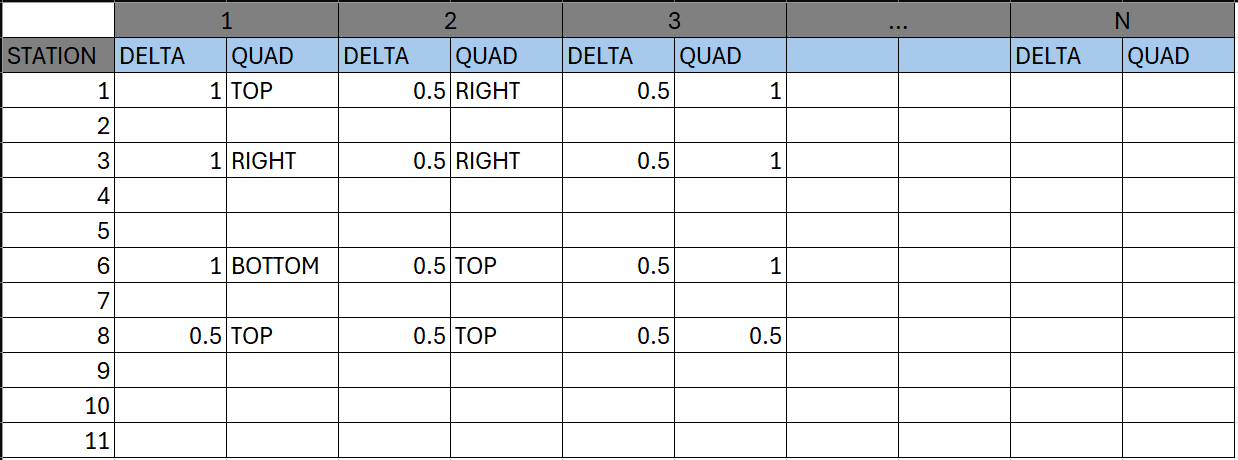
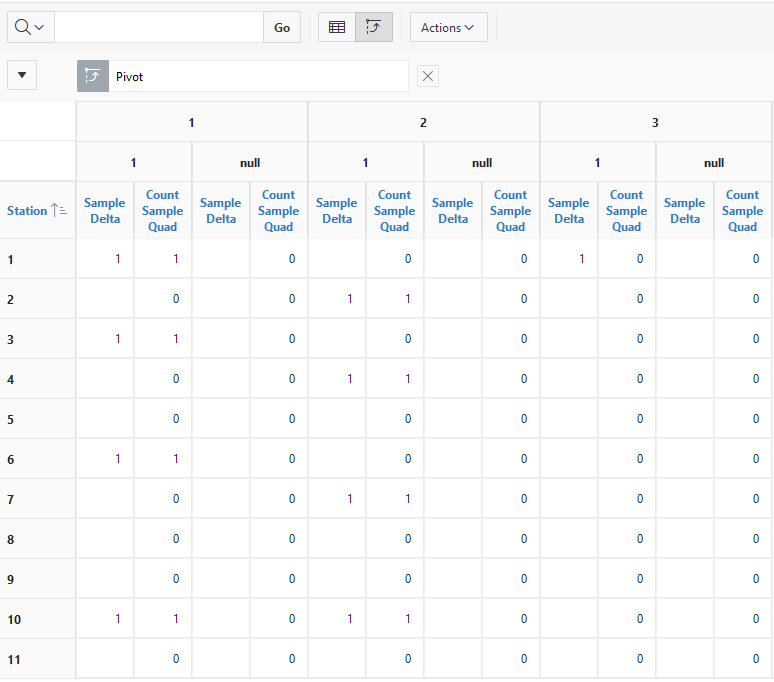
Below is almost what I want, the issue is I cant get the SAMPLE_QUAD column to show. The idea is that the station is on the left, and each new sample taken will enter 11 rows into the database, which will then be added to the far right of the table. So the next sample would be 4, and you would have Sample Delta and Sample Quad underneath for that sample.
Is there any way I can do this? I dont need to use pivot. I can use a view, I can change the table however is required.
Ideally I want it to look like this: