Hi All,
I am using Apex version 4.2.5.00.08
I am attempting to create a 2D Line chart with and X Axis of Date and a Y Axis of Time (in Hours).
In the chart series it is possible to use a date as a label. However, when attempting to use the time as a value I have come across an issue. As far as I can tell the VALUE field in the example chart query below, is expecting a numeric number. I have been able to produce the chart when converting the time to a number e.g. 17:25pm becomes 1,725. I would prefer to have the actual values shown as times though. I have attached an image below for clarification:
[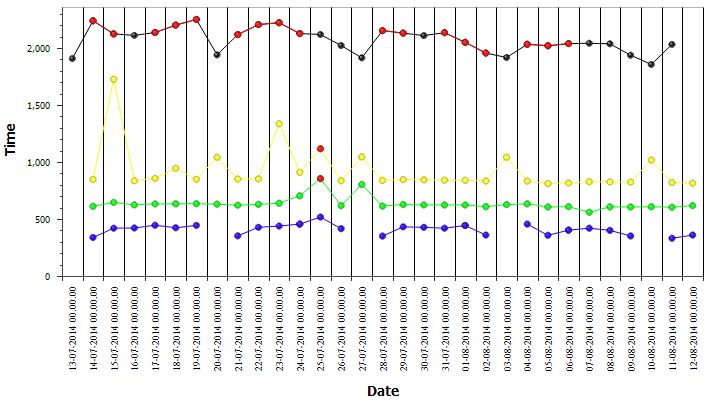 ](/servlet/JiveServlet/showImage/2-12583035-5675/Example line chart.JPG)
Thanks for any help in advance,
Jiminy.