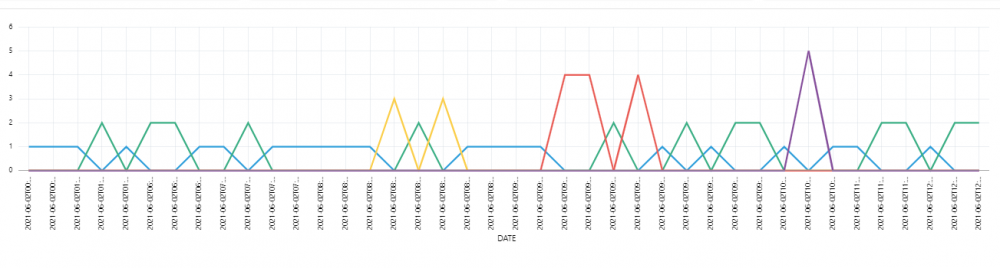
Hello, I am 'Trying' to make a line chart which displays dates on the X axis and visitor count on the Y, I sum up the visitorIDs grouping by date and my outcome is this. Also my date column only has the date and not time and I have also set the value - format as 'date-short'.
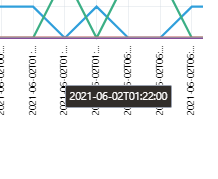
The Date shown in the smaller image doesn't show the correct date in my table columns, I have never seen this before? and as I have set the date format to date-short why is it displaying time?
Any help will be appreciated, I will reply to questions ASAP, thank you.
 MY SQL:
select distinct
count(visitorID) over (partition by VISIT_DATE) as "Visitors",
VISIT_DATE
from all_visits_demo avd,
Users u
where upper(u.username) = :APP_USER
and u.site_uuid = avd.SITE
and TO_CHAR(VISIT_DATE,'DD-MM-YYYY') BETWEEN :P90_FDATE AND :P90_TDATE