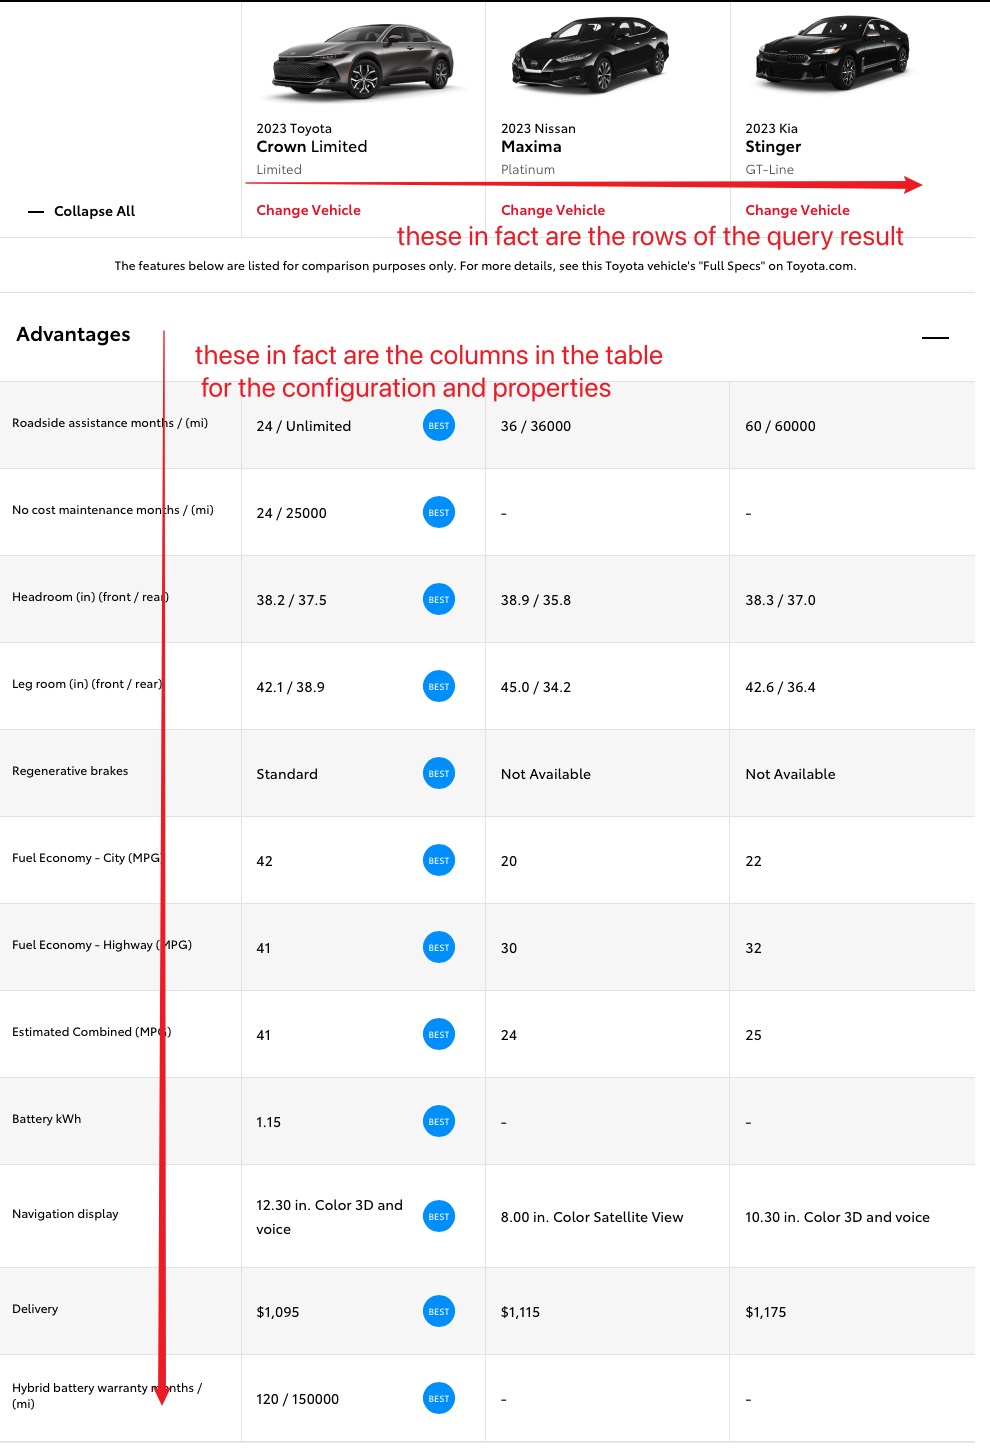
I have a table with over 50 columns. It is a table with device configuration and properties data. If the table shown in the normal way, the columns will overflow the width of the brower. So the better way is to rotate the table/report 90 degree to make the rows shown as columns and columns shown as rows. I think it likes a pivot without aggregation. What I want to achieve is like below, a care comparation. Is there a easy way or a plug-in to achieve this?