DB version: 11.2.0.4
Platform : RHEL 6.4
We have 46GB of UNDO Tablespace in the DB in question.
On July 14, between 12:00 AM till 8:00AM, we encountered several ORA-1555 issues in the DB.
Info provided by OEM:
=====================
Selected Analysis Time Period : Jul 14, 2015 12:00:00 AM BST To Jul 14, 2015 8:00:00 AM BST
Longest Running Query (minutes) : 197.0
Average Undo Generation Rate (KB/minute) : 198,685.0
Maximum Undo Generation Rate (KB/minute) : 366,282.0
Queries failed due to low Retention : 0
Transactions failed due to small Undo Tablespace: 0
OEM UNDO Advisor recommended to increase the UNDO tablespace size from 46 GB to 96 GB. But, if no transactions have failed due to small Undo tablespace (as shown above), then why should I increase the UNDO Tablespace size ?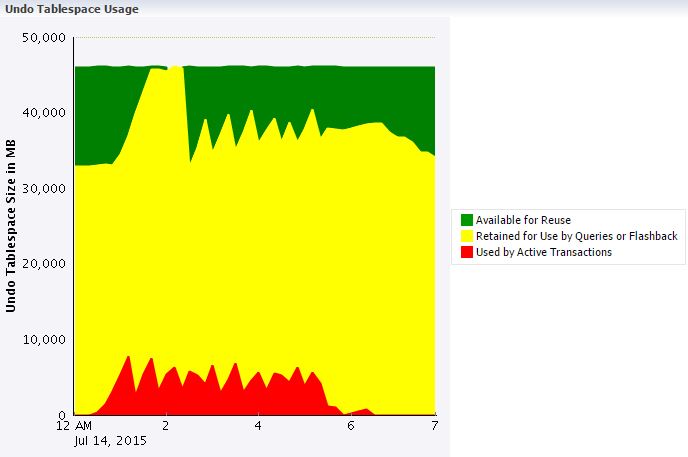
In OEM 12C (Enterprise Manager), we ran UNDO Advisor and it generated the following graph for the period July 14, 12:00 AM till 8:00AM . Any idea what this graph essentially says ?