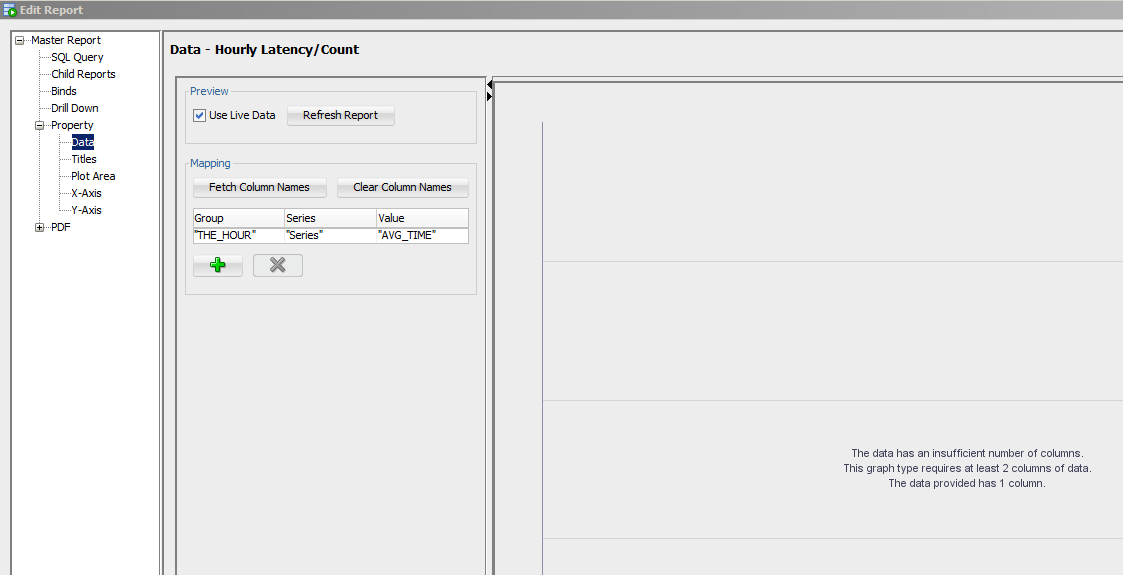
I created a chart with the following query, but it seems that I always get the message: "The data has an insufficient number of columns. This graph type requires at least 2 columns of data. The data provided has 1 column". My "mapping" in the "Data" section has the correct entries. What am I doing wrong? I've tried deleting the mapping, re-fetching the column names and re-creating the mapping. I've even tried copying the SQL statement into a completely new report/chart. Why does it think that there is only 1 column in the data?
select
'latency' "Series",
trunc(response_sent, 'HH24') "THE_HOUR",
round(avg(total_txn_time),0) "AVG_TIME"
from irx_pos_response a
where response_sent >= TO_DATE( '2016-07-27', 'YYYY-MM-DD')
and response_sent < TO_DATE( '2016-07-27', 'YYYY-MM-DD') + 1
group by 'latency', trunc(response_sent, 'HH24')
order by trunc(response_sent, 'HH24') asc