Hello,
one of our customers reported that exporting resultset to .xslx format (Excel 2003+) yields a file that is 0 Bytes in size. Export to any other format seems to work fine.
Problem can be reproduced with any other user on that system. We have upgraded the system to run latest versions of software:
[16:46:38 sys36@oraclerdp01 ~]$ cat /etc/oracle-release
Oracle Linux Server release 7.7
[16:47:33 sys36@oraclerdp01 ~]$ java -version
java version "1.8.0_241"
Java(TM) SE Runtime Environment (build 1.8.0_241-b32)
Java HotSpot(TM) 64-Bit Server VM (build 25.241-b32, mixed mode)
and SQL Developer 19.4.
After enabling tracing and debugging in sqldeveloper.conf this is the result:
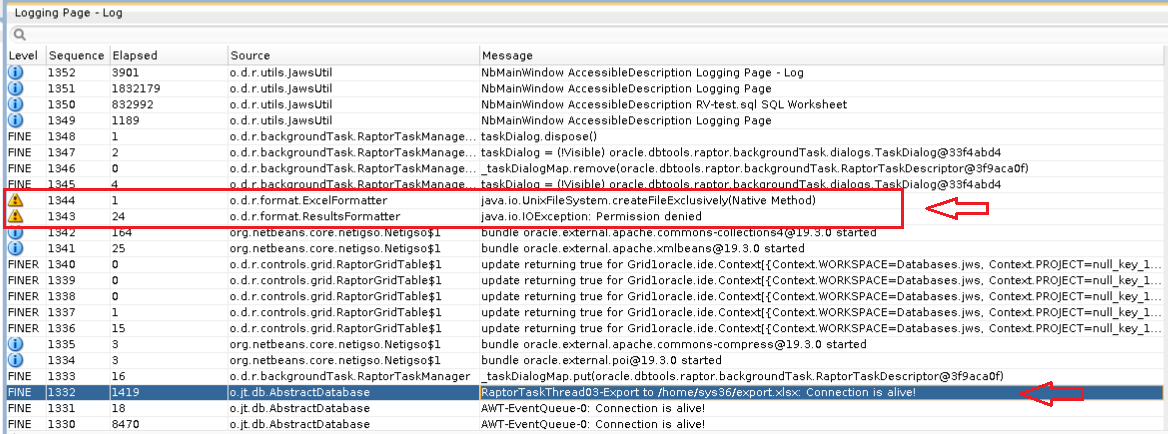
Facts we have determined so far:
- SELinux is disabled
- running SQL Developer as root -> export in xslx work fine!
- running SQL Developer as non-root -> permission denied saving xslx file; saving in any other format works fine!
It's most probably a filesystem permissions issue. Is there any way to obtain a complete Java Stack trace to see the exact location to which SQL Developer wants to write? We speculate that has to be some sort of temporary location (other than /tmp) which SQL Developer uses before saving results in xslx format, hence "permission denied" by the OS.
PS: https://community.oracle.com/thread/4319639 has a similar question but OP never returned...
Regards,
Samo