Hi guys,
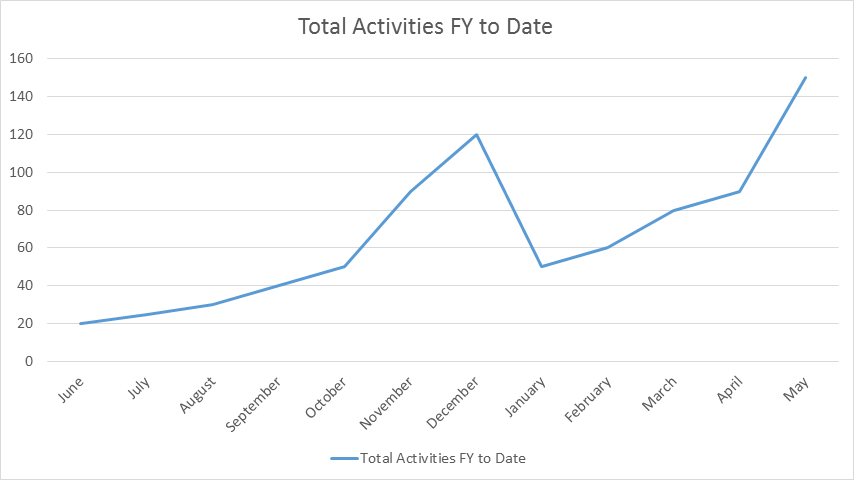
I encountered a problem when trying to make a chart like this:
I have tried using both Flot Line Chart and D3 Line Chart, and looking at the example from the Sample Charts in Apex packaged apps:
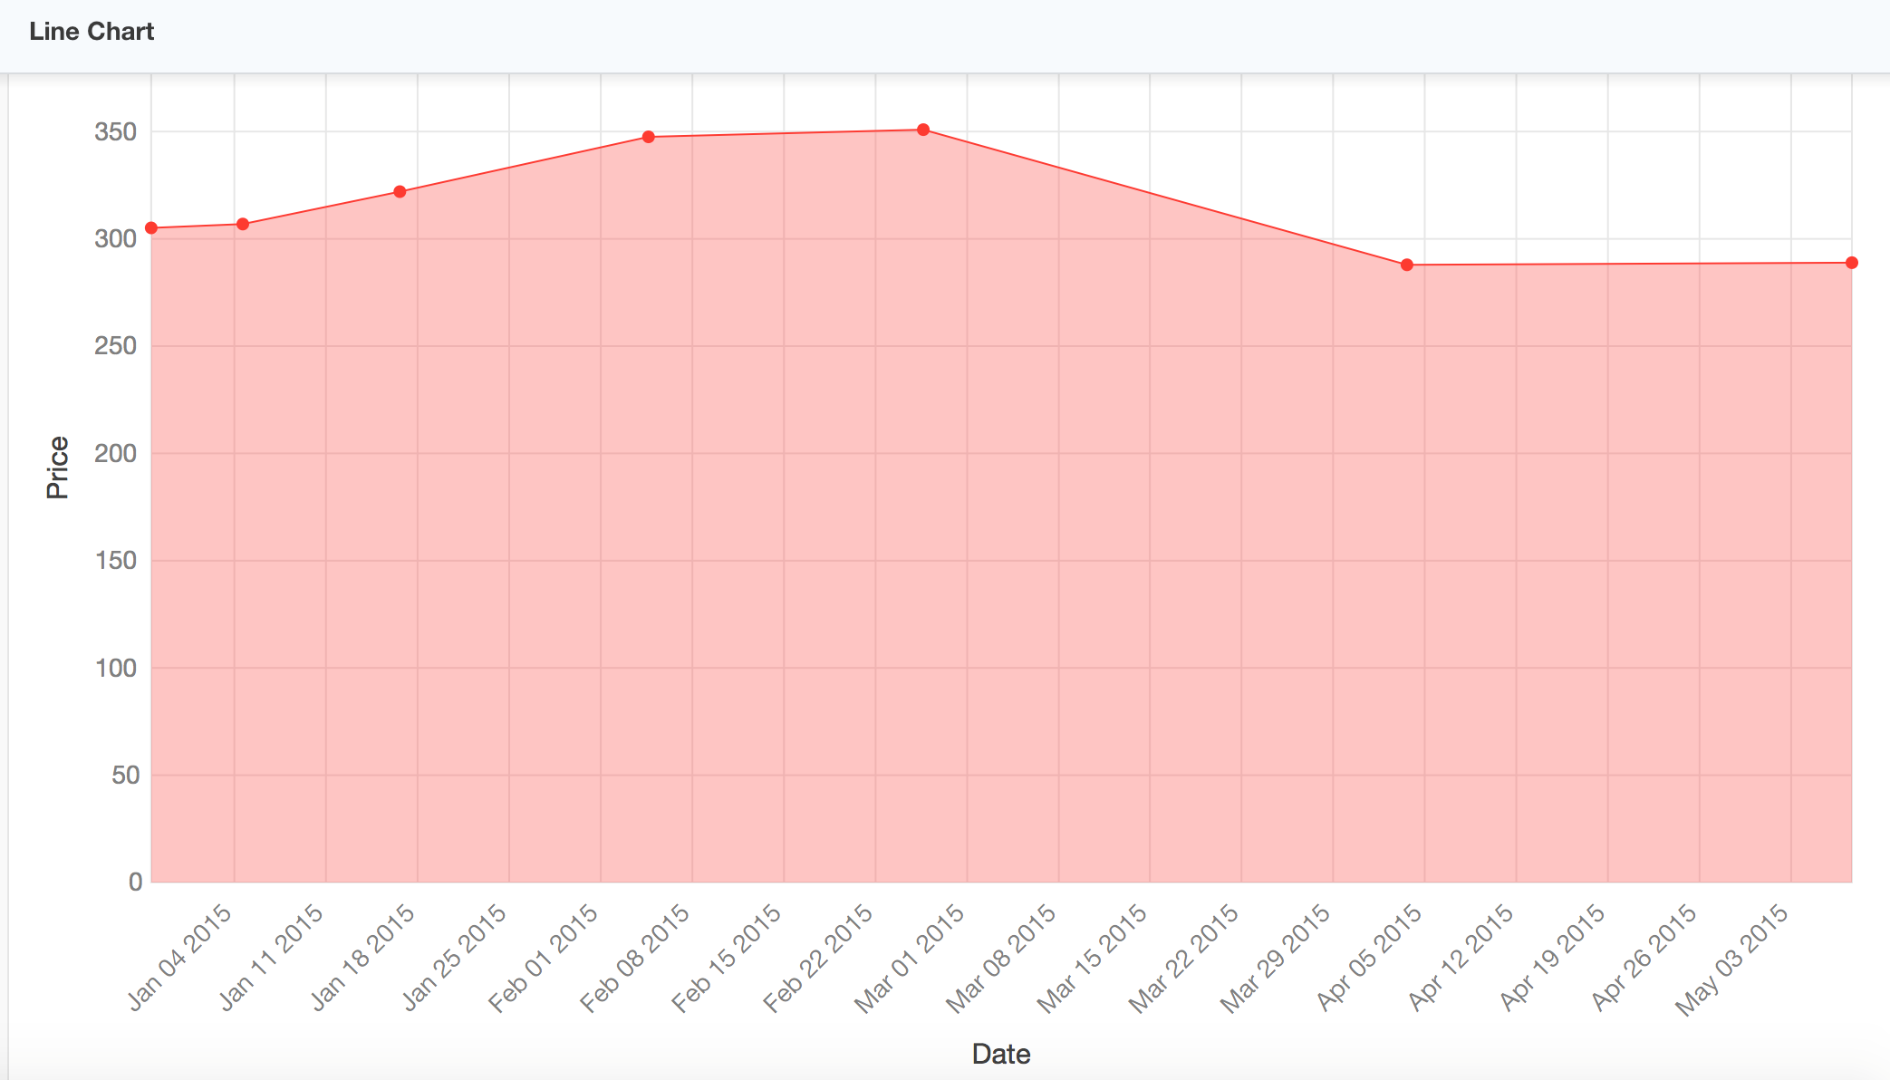
so based on the example above (figure 2), the chart is displaying the x-axis by date (full mm/dd/yyy). What I want (figure 1) is displaying per month only, based on fiscal year (Jun to May). But it seems my query does not want to work if it is not DATE type? Here is my query:
SELECT
EXTRACT(MONTH FROM Activity\_Date) "Month",

COUNT(\*) "Number of Activities"
FROM
Activity a
WHERE
(
(Activity\_Date BETWEEN

     TO\_DATE( :P1\_YEARS-1 || '/06/01', 'yyyy/mm/dd' ) AND

     TO\_DATE( :P1\_YEARS || '/05/31', 'yyyy/mm/dd' ) )
)
GROUP BY
EXTRACT(MONTH FROM Activity\_Date)
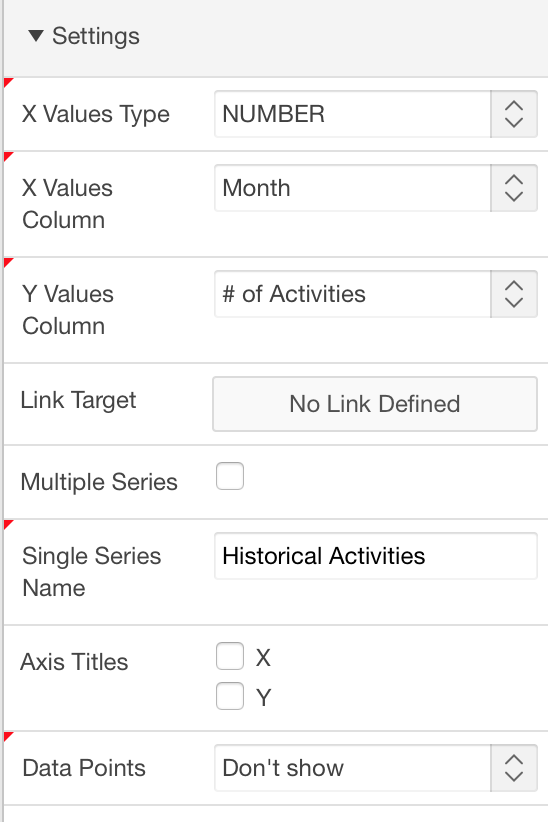
Upon selection of x-value, I set the type as NUMBER and the "Month" column as value. But the chart does not appear and displaying weird number at axis:
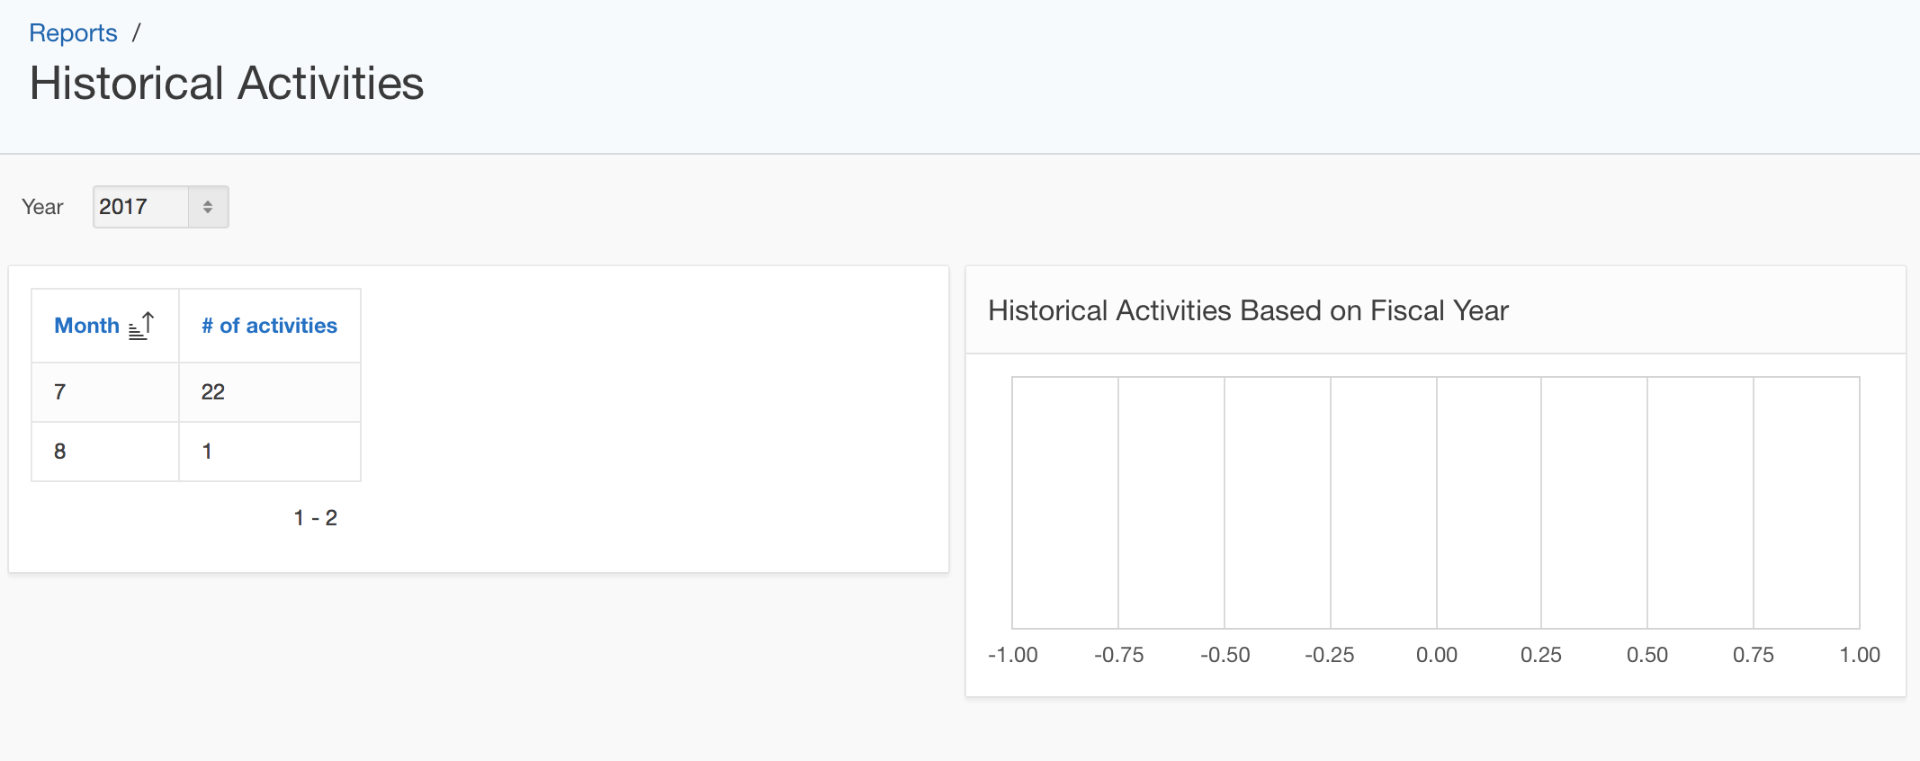
Setting the month as varchar2 (e.g. to_char(Activity_Date, 'Mon')) will make the x-value not accepted (only DATE, TIMESTAMP, and NUMBER accepted).
Does this mean the chart can only work if the x-value is of DATE type? Is it possible to force the Extracted Month in the query as DATE type? Or do I miss something here? Any help will be appreciated!
I am using Apex v5.0.3.
Danny