Hi all,
I am fresh fish in apex and javascript
I need some help

I have one table with values and dates for WBC series and NEUT series. I have hundreds of those data/lines
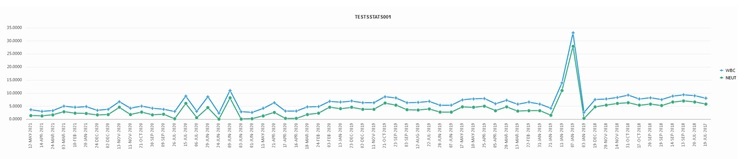
I did built a chart like this
 I have a second table with minimum and maximum values
In example WBC minimum value is 4 and WBC maximum values is 10
I need to have a RED different marker whenever the values are higher than 10 or lower than 4 for WBC
Can you please help me with some sample javascript I can use in the javascript section of JET graph, so I can solve it?
Thanks in advance.