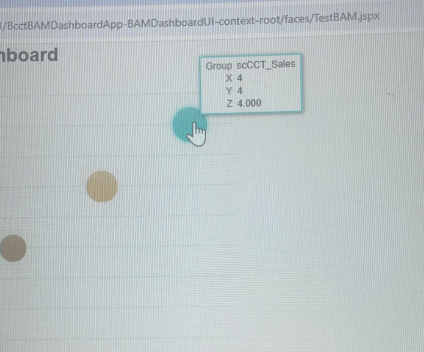
I want to show only Group Name i dont want to show anything else
Jedv: Studio Edition Version 12.2.1.4.0
<dvt:bubbleChart id="bubbleChart1" var="row" value="#{bindings.CctGroupsByUsersRVO.collectionModel}"
title="Groups wise user counts" footnoteHalign="center" dataSelection="single"
inlineStyle="width:550px;height:400px;" coordinateSystem="cartesian"
hideAndShowBehavior="withRescale" hoverBehavior="dim" seriesEffect="gradient"
emptyText="No Users Logged in so far......">
<f:facet name="dataStamp">
<dvt:chartDataItem id="di1" x="#{row.UserCount}" y="#{row.UserCount}" z="#{row.UserCount}"
group="#{row.GroupName}" high="100" low="1">
<dvt:attributeGroups label="#{row.GroupName}" id="ag2" type="color"
value="#{row.GroupName}"/>
<dvt:attributeGroups id="ag1" value="12"/>
</dvt:chartDataItem>
</f:facet>
<dvt:chartValueFormat id="cvf1" type="x" scaling="none">
<af:convertNumber type="number" integerOnly="true" minFractionDigits="0"
maxFractionDigits="0"/>
</dvt:chartValueFormat>
<dvt:chartValueFormat id="cvf2" type="y" scaling="none">
<af:convertNumber type="number" integerOnly="true" minFractionDigits="0"
maxFractionDigits="0"/>
</dvt:chartValueFormat>
<dvt:chartXAxis id="cxa1" rendered="false">
<dvt:chartTickLabel rendered="false" id="ctl1"/>
<dvt:chartAxisLine id="cal1" rendered="false"/>
<dvt:minorTick id="mt1"/>
</dvt:chartXAxis>
<f:facet name="overview"/>
</dvt:bubbleChart>