Hi forum,
I am very new to Oracle Jet and have a question about how to enable/disable buttons in an ojButtonset with javascript/jQuery
dynamically based on the number of measures that will be displayed in a Jet chart.
I am using Oracle Jet 2.0.1.
All the details follow.
Thanks for all helpful suggestions in advanced.
David
Below is some of the HTML that is used. The bolded section below has an ojButtonset component that want to
enable/disable dynamically when the user refreshes the data that they wish to display in the Oracle Jet Chart.
The user may start out with one measure in which case we want to disable the stack chart buttons. The user then
may present two measures in a refresh at which time we want to enable the stack chart buttons.
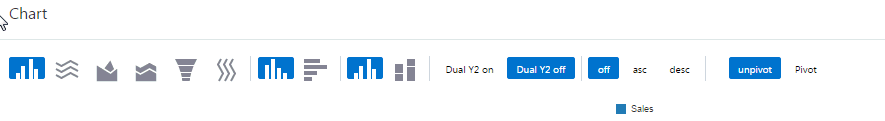
Below first is the image of the tool bar that is used. There are multiple ojButtonsets on the tool bar. The one I am interested in
programmatically enabling/disabling are the two buttons to the left of Dual Y2 on on the stacked buttons. We
would like to disable the two stacked buttons (standard or stacked) if we are presenting in the chart only one measure. I read the Oracle Jet
programming guide and the APIs but am unable to get this to wok. Here is some code I tried to put in based on
reading the ojButtonset API. I may be way off here, but this provides my intention clearly.
/* disable the stacked chart radio button if only one measure and enable if more than 1 measure */
/* jQuery selector starts at the div and finds the first ojButtonset for the div */
/* This code is fired during the refresh of the chart when new information including the number of measures to be
displayed is provided */
if (chartData.seriesValue.length < 2) {
$("div#radioButtonset2 :oj-buttonset").first().ojButtonset( "option", "disabled", true);
}
else {
$("div#radioButtonset2 :oj-buttonset").first().ojButtonset( "option", "disabled", false);
}
Google chrome gives the error:
jquery-2.1.3.min.js:2 Uncaught Error: Syntax error, unrecognized expression: unsupported pseudo: oj-buttonset
<div class="t-Region-body">
\<div id='avchart-container' style="height:900px;">
<div id="myToolbar" aria-label="Chart Display Options Toolbar" aria-controls="barChart"
   data-bind="ojComponent: {component:'ojToolbar'}"

   style="max-width:850px;width:100%;height:75">

    \<!-- chartType buttons -->

    \<div id="radioButtonset2" data-bind="ojComponent: {component: 'ojButtonset', focusManagement:'none', checked: chartTypeValue, chroming: 'half'}"

         aria-controls="barChart" aria-label="Choose a Chart Type.">

        \<!-- ko foreach: chartTypeOptions -->

          \<label data-bind="attr: {for: id}">\</label>

          \<input type="radio" name="bar"

               data-bind="value: value, attr: {id: id},

               ojComponent: {component: 'ojButton', label: label,

                                 icons: {start: icon}, display: 'icons'}"/>

        \<!-- /ko -->

      \<span role="separator" aria-orientation="vertical" class="oj-toolbar-separator">\</span>

    \<!-- unstacked/stacked toggle button -->

    **\<div id="radioButtonset2" data-bind="ojComponent: {component: 'ojButtonset', focusManagement:'none', checked: stackValue, chroming: 'half'}"**

         **aria-label="Choose a stack setting.">**

        **\<!-- ko foreach: stackOptions -->**

          **\<label data-bind="attr: {for: id}">\</label>**

          **\<input type="radio" name="stack"**

               **data-bind="value: value, attr: {id: id},**

               **ojComponent: {component: 'ojButton', label: label,**

                                 **icons: {start: icon}, display: 'icons'}"/>**

        **\<!-- /ko -->**

    \</div>
... not all HTML is shown that we use, but this is the important section ...
For completeness, here is some of the code that instantiates the ChartModel if this is helpful. The stack options
is bolded below so that you can see the model and view link and how Jet binds them together.
function renderChart() {
require(['ojs/ojcore', 'knockout', 'jquery', 'ojs/ojknockout', 'ojs/ojbutton', 'ojs/ojchart', 'ojs/ojinputtext', 'ojs/ojtoolbar'],
function(oj, ko, $)
{
function ChartModel() {

    var self = this;

    self.somethingChecked = ko.observable(true);

    self.newChartData = function(data, event) {

        console.log('newChartData called');

        newSeries();

    }

    // toggle button variables

    self.orientationValue = ko.observable('vertical');

    self.stackValue = ko.observable('off');

    self.chartTypeValue = ko.observable('bar');

    self.threeDValue = ko.observable('off');

    self.renderSeparators = ko.observable("on");

    self.dualY = ko.observable('off');

    self.sortingValue = ko.observable('off');

    self.separatorColor = ko.observable('#C4CED7');

    self.dataSetValue = ko.observable('unpivot');

    self.seriesValue = ko.observableArray(chartData.seriesValue);

    self.groupsValue = ko.observableArray(chartGroupsValueData);

    var converterFactory = oj.Validation.converterFactory('number');

    var currencyConverter = converterFactory.createConverter({style: 'currency', currency: 'USD'});

    self.yAxisConverter = ko.observable(currencyConverter);

    var valueFormat = \[{type:'y', converter: currencyConverter}, {type: 'group', tooltipLabel: \['Region', 'Department', 'Quarter'\]}\];

    self.valueFormatsValue = ko.observable(valueFormat);

    var styleData = {groupSeparators: {rendered:ko.toJS(self.renderSeparators), color: ko.toJS(self.separatorColor)}};

    self.styleDefaultValue = ko.observable(styleData);

    // toggle buttons

    self.orientationOptions = \[

        {id: 'vertical', label: 'Vertical', value: 'vertical', icon: 'oj-icon demo-bar-vert'},

        {id: 'horizontal', label: 'Horizontal', value: 'horizontal', icon: 'oj-icon demo-bar-horiz'}

    \];

    **self.stackOptions = \[**

        **{id: 'unstacked', label: 'Unstacked', value: 'off', icon: 'oj-icon demo-bar-unstack'},**

        **{id: 'stacked', label: 'Stacked', value: 'on', icon: 'oj-icon demo-bar-stack'}**

    **\];**
... not all code in function shown ...