Hi All,
I am newbie in oracle apex charts and here i'm stuck with situation where i'm not able to move forward.
I have a cart which displays data for a consecutive months and i have to user the stack chart for displaying the data.
But the data holds different series for all months and the charts should display in different bars(side by side for different series) within same months.
Is there a way to accomplish this..
I'm using APEX - 5.1.2 in oracle DB 11g..
Below pasting the screenshots for reference..

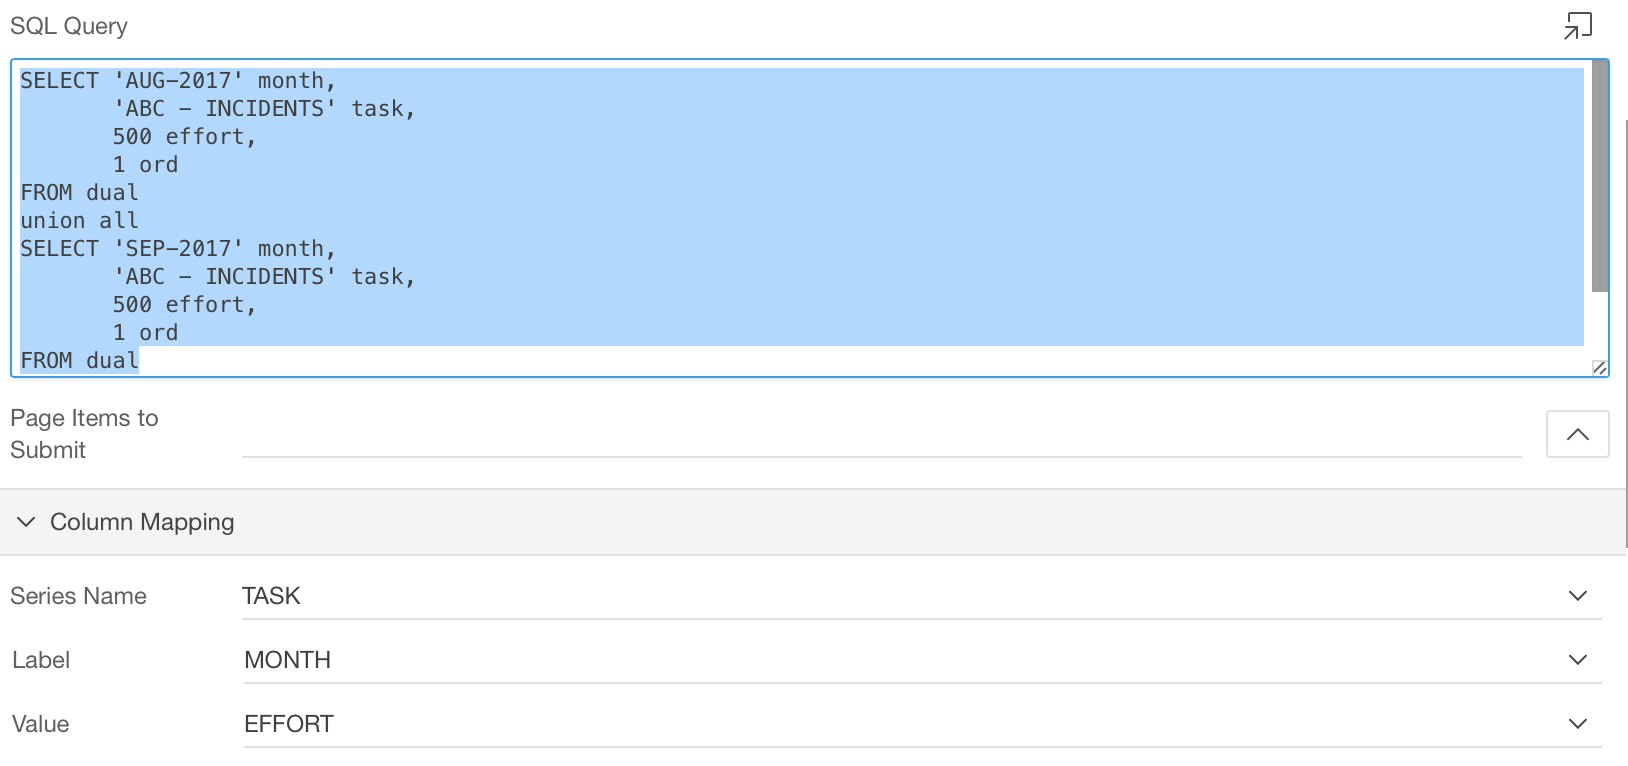
SELECT 'AUG-2017' month,
   'ABC - INCIDENTS' task,

   500 effort,

   1 ord
FROM dual
union all
SELECT 'SEP-2017' month,
   'ABC - INCIDENTS' task,

   500 effort,

   1 ord
FROM dual
----------------------------------------
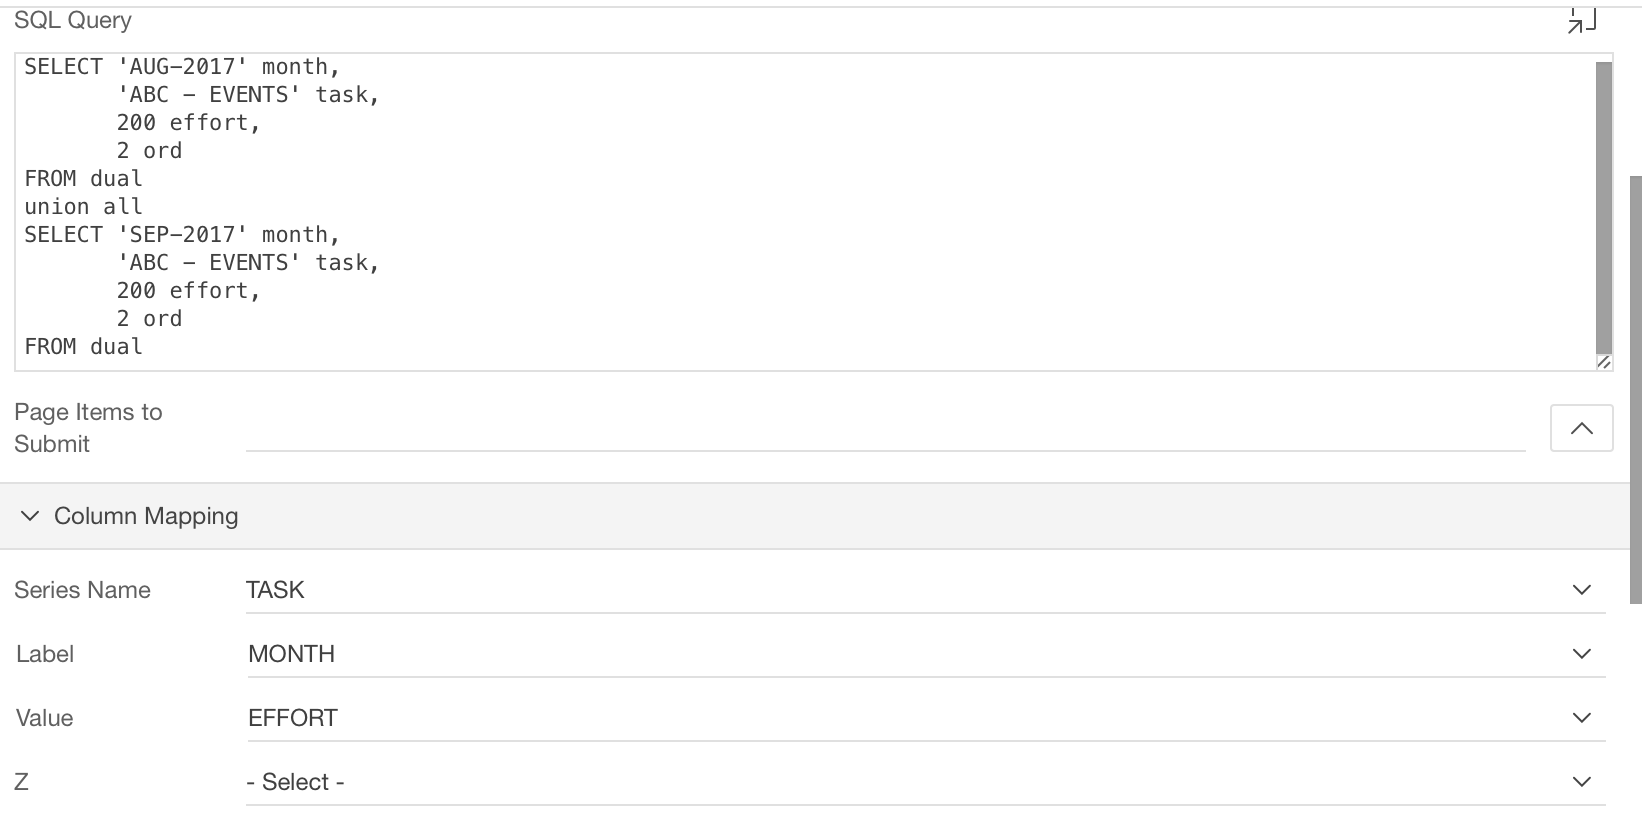
SELECT 'AUG-2017' month,
   'ABC - EVENTS' task,

   200 effort,

   2 ord
FROM dual
union all
SELECT 'SEP-2017' month,
   'ABC - EVENTS' task,

   200 effort,

   2 ord
FROM dual
-------------------------------------------------------------
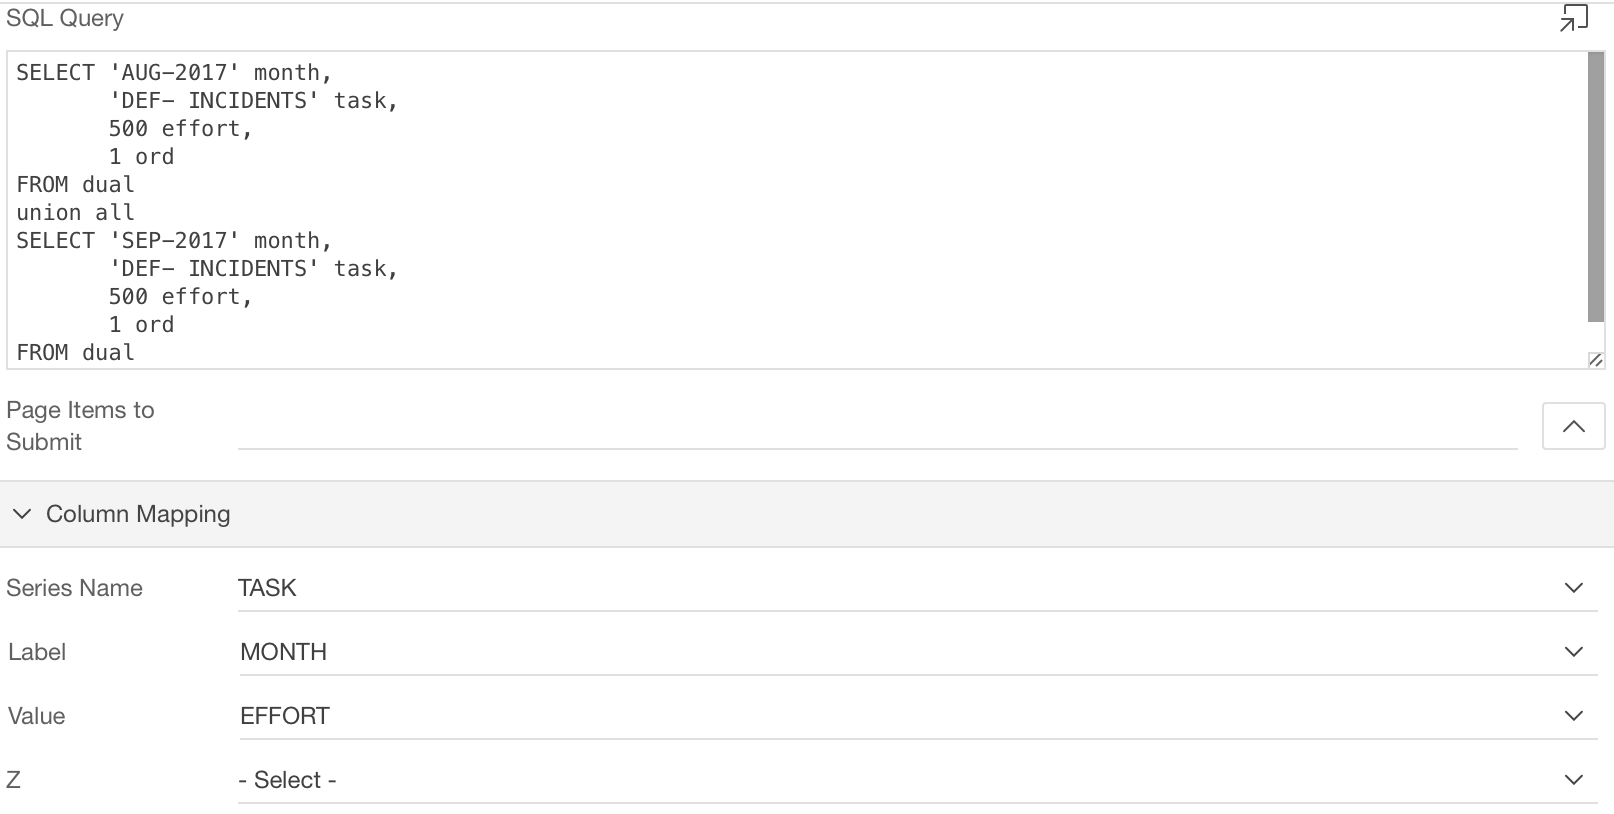
SELECT 'AUG-2017' month,
   'DEF- INCIDENTS' task,

   500 effort,

   1 ord
FROM dual
union all
SELECT 'SEP-2017' month,
   'DEF- INCIDENTS' task,

   500 effort,

   1 ord
FROM dual
-------------------------------------
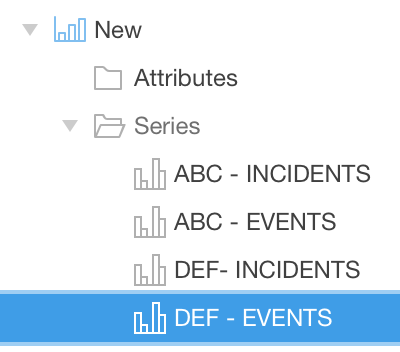
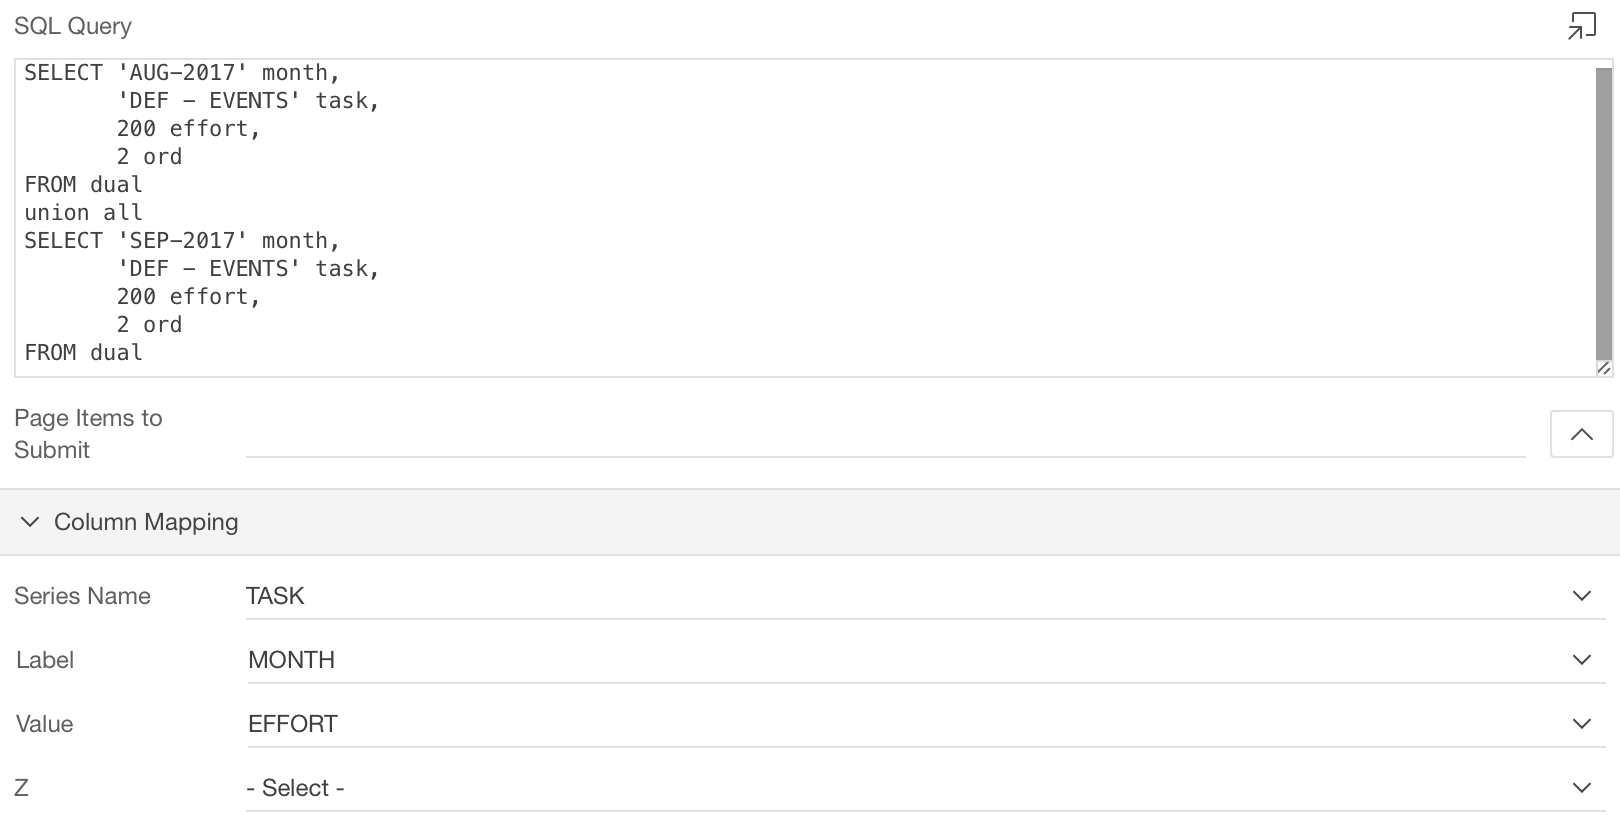
SELECT 'AUG-2017' month,
   'DEF - EVENTS' task,

   200 effort,

   2 ord
FROM dual
union all
SELECT 'SEP-2017' month,
   'DEF - EVENTS' task,

   200 effort,

   2 ord
FROM dual
------------
When i'm running it i'm getting this as output.Since it's stacked it'll normally comes like this but what i really want is DEF-INCIDENT and DEF-EVENTS series as new bar adjacent to each other but stacked with it's own series(yellow and orange as next bar but both stacked.)

Please put your thoughts to achieve this, if there's a way for that.
Your comments will be really appreciated.
Thank You.