Hi,
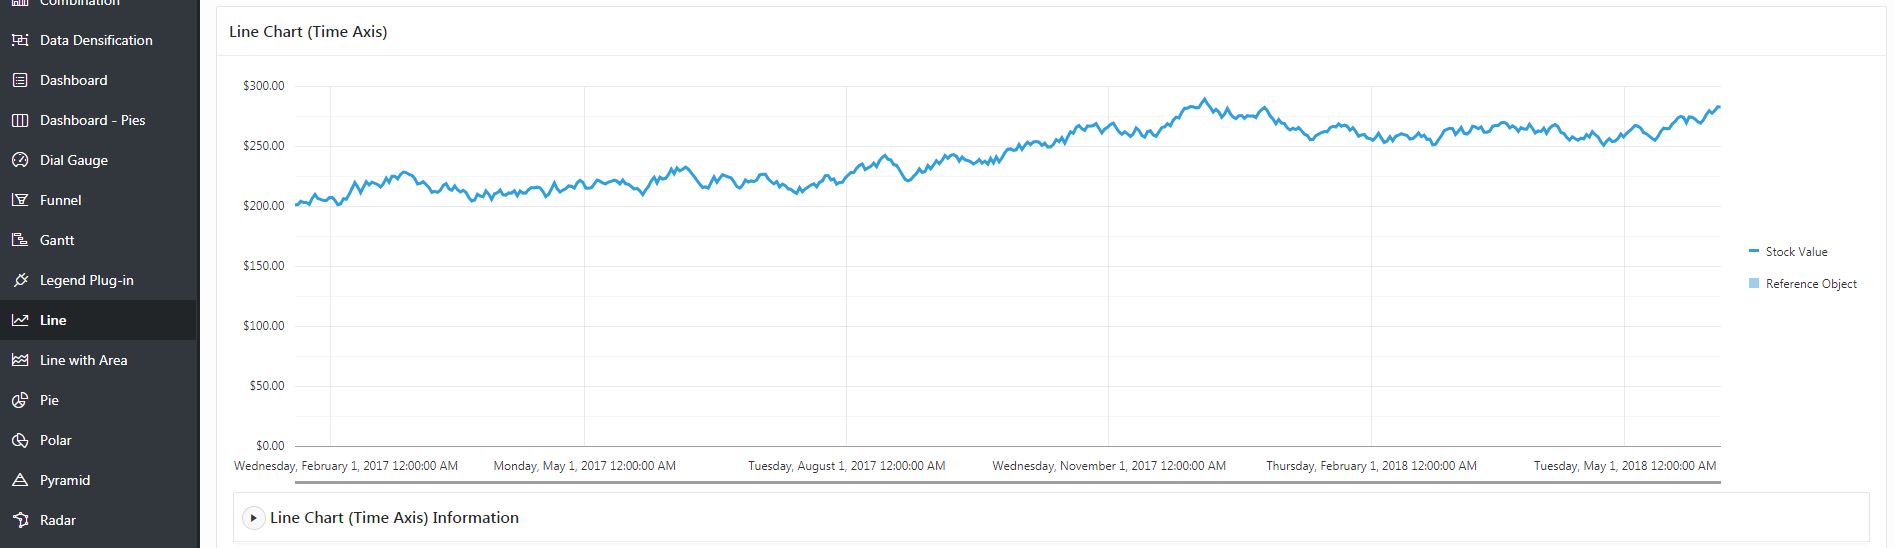
I would like to edit the Line Chart (Time Axis) in the Packaged App "Sample Charts" by adding a reference area on xAxis. On the legend one can see that the reference area was added, but on the chart itself it doesn't appear. Could you please help me by solving this issue. Thank you in advance.
Here is JS Code:
function( options ) {
// Define Reference Object line on Y Axis of chart

var constantLineX = \[ {text:"Reference Object", type: "area", low: "28/01/2017", high: "14/02/2017", color: "#A0CEEC", displayInLegend: "on", location: "back", shortDesc: "Sample Reference Area"}\];

// Set the referenceObjects option as part of the chart initialization

options.xAxis.referenceObjects = constantLineX;

return options;
}
}