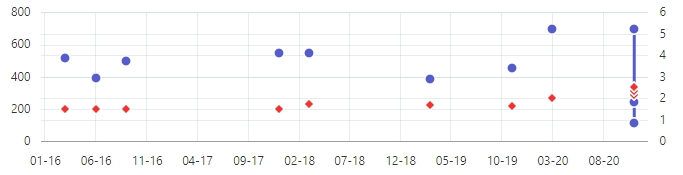
I have a Line Chart where I am displaying 5 years worth of data for two measures. I have a Y and Y2 axis and the X-Axis is a Date for all months.
Since the label on the X-Axis is being represented in a horizontal manner, I believe that the labels are only appearing every 5 months. Is there a way where I can reduce the font-size and rotate them by 90% to display all the months (or alternate months) in its entirety?
Thanks!