Hi,
I am trying to create a server side report that contains some of the JET DVT graphs from a page in my application.
The idea is to send image data as base64 to the server and put that in a report.
The concept works fine, I use the html2canvas library. It works fine except that it doesn't capture the graphs.
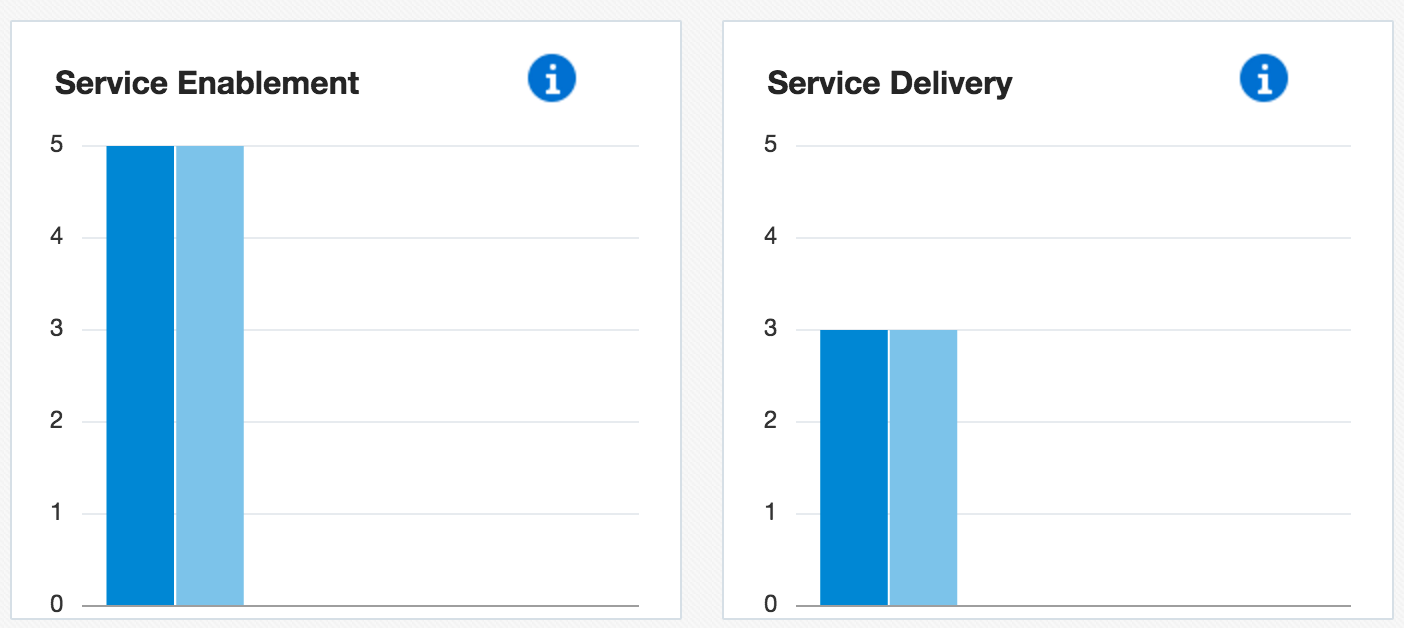
My graph shows this:
whereas the captured image shows this:
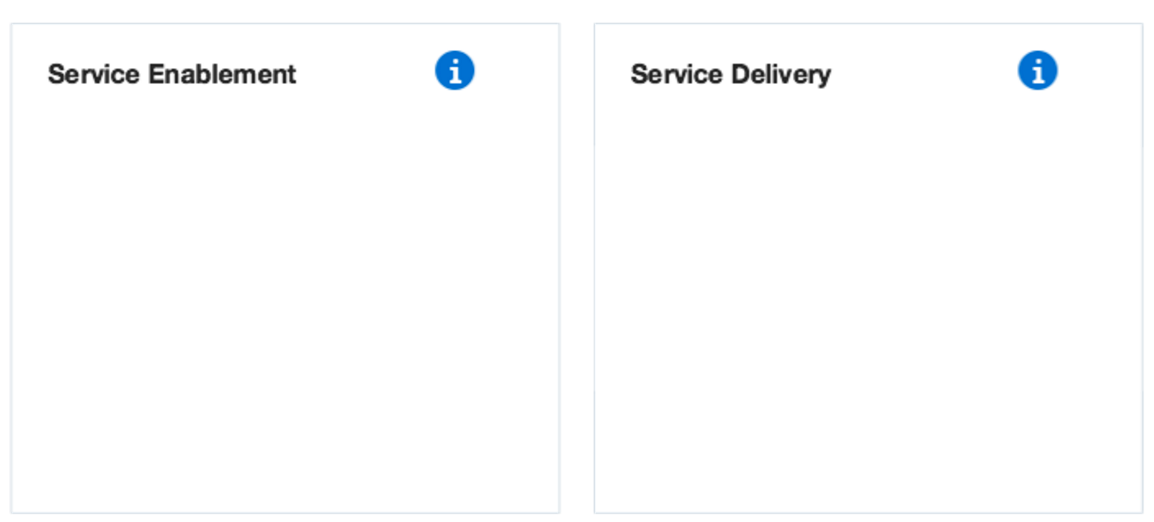
I know from the HTML that the JET DVT graphs are rendered as SVG. And HTML2Canvas has troubles when it comes to SVG (https://github.com/niklasvh/html2canvas/issues/95).
Is there anyone out here who has either, used html2canvas successfully with Oracle JET, or has had the same requirement (capture graphs as image) and was able to solve it?
One option that I see is to draw all svg to a temporary canvas and then remove that canvas once I take the screenshot using html2canvas. That of course is more of a workaround than a solution.
All of this also makes me wonder why Oracle JET is using SVG instead of canvas. Probably has to do with poor text rendering capability, lack of animation, as well as limited accessibility support in canvas, am I right?
Anyway, if there is something you can add to this discussion, please share.
Thanks
Luc