Oracle Database 12.2.0
RHEL 7.4
Hello Team,
I have noticed that there is very high I/O wait on my database where ASM is configured.
Extract from alert log:
ns secondary err code: 12560
TNS-12541: TNS:no listener
nt main err code: 511

ns secondary err code: 12560

nt main err code: 511
TNS-00511: No listener
nt secondary err code: 111
TNS-00511: No listener
nt OS err code: 0

nt secondary err code: 111

nt OS err code: 0
2019-04-09T10:04:49.840281+04:00
WARNING:io_getevents timed out 600 sec
2019-04-09T10:06:22.269531+04:00
WARNING:io_getevents timed out 600 sec
2019-04-09T10:07:11.432429+04:00
WARNING:io_getevents timed out 600 sec
2019-04-09T10:09:33.538552+04:00
WARNING:io_getevents timed out 600 sec
2019-04-09T10:10:04.687501+04:00
WARNING:io_getevents timed out 600 sec
Errors in file /u01/app/oracle/diag/rdbms/dware1/DWARE1/trace/DWARE1_ora_13750.trc (incident=673015):
ORA-00494: enqueue [CF] held for too long (more than 900 seconds) by 'inst 1, osid 6227'
2019-04-09T09:59:04.452946+04:00
Killing enqueue blocker (pid=6227) on resource CF-00000000-00000000-00000000-00000000 by (pid=13750)
by terminating the process
2019-04-09T09:59:04.470010+04:00
Attempt to get Control File Enqueue by USER pid=13750 (mode=X, type=0, timeout=300) is being blocked by inst=1, pid=6227
Please check inst 1's alert log for more information on the blocker including a possible ORA-00494 and related incident logs
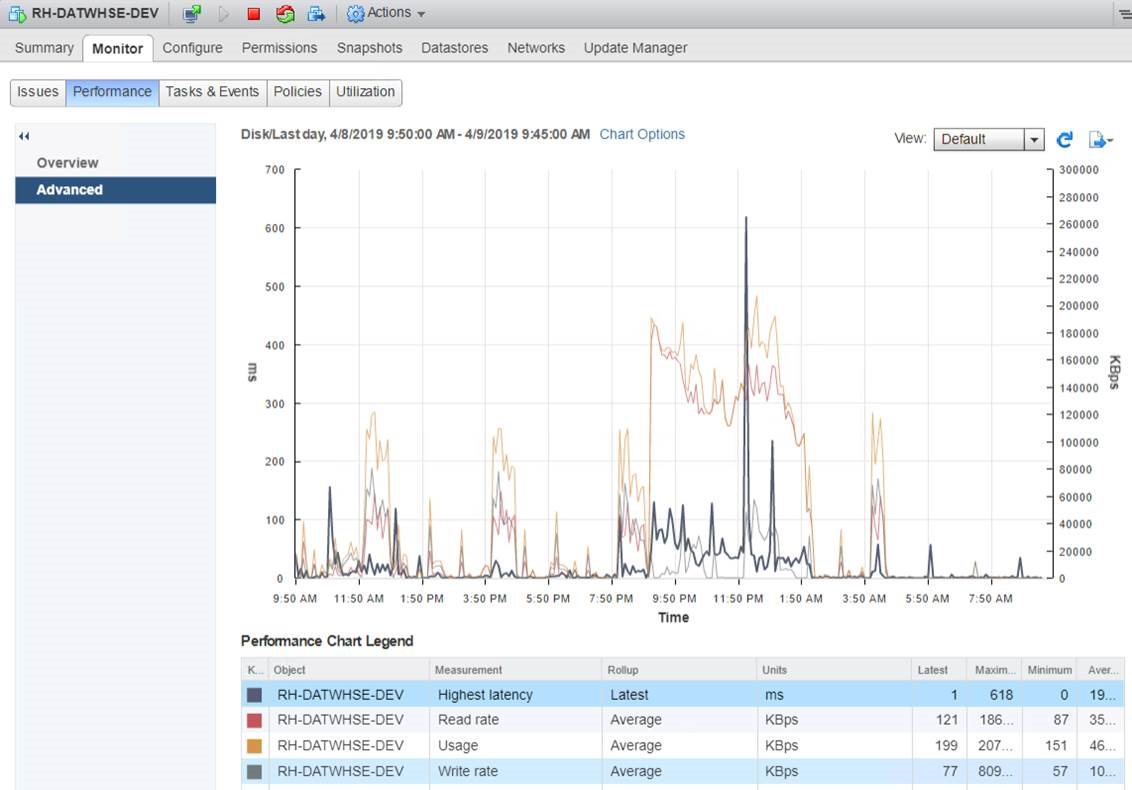
I also see the %util for 2 disks is very high.
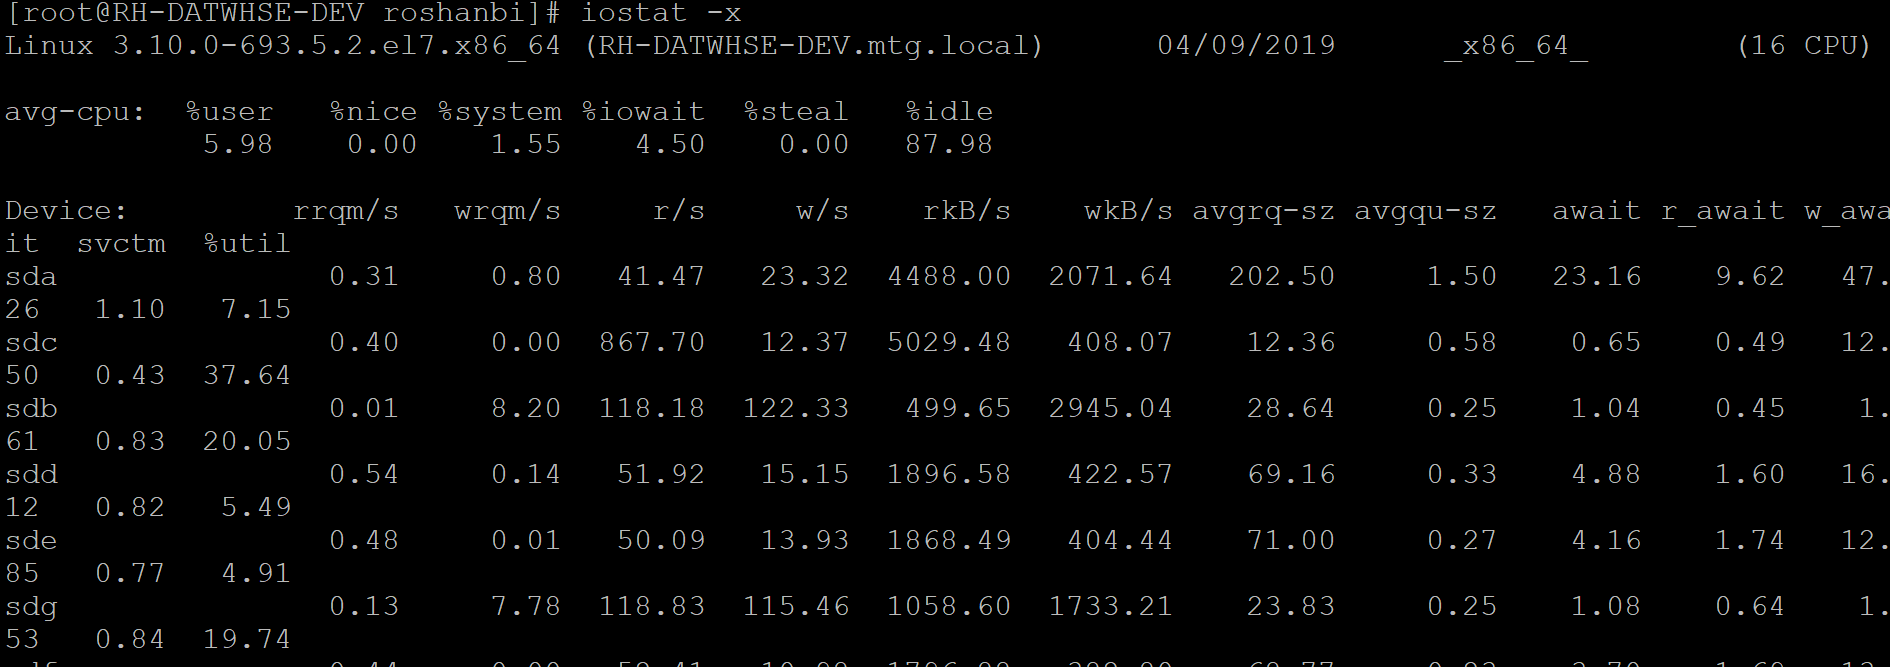
We have noticed that %util is very high between 09 to 12:00 since fulll table scan is being performed on tables with parallelism enabled
Please advise.
Thanks,
Joe