-- Briefing ----- --------
Hello everybody
I need some help debugging a recent problem I've encountered in one of our production databases.
It is a RAC 11.2 (as per the banner below).
One particular insert is taking a lot of time (in cluster wait time).(I''ve attached a cutted image from ASH@grid)
when compared with time spent in other wait classes.
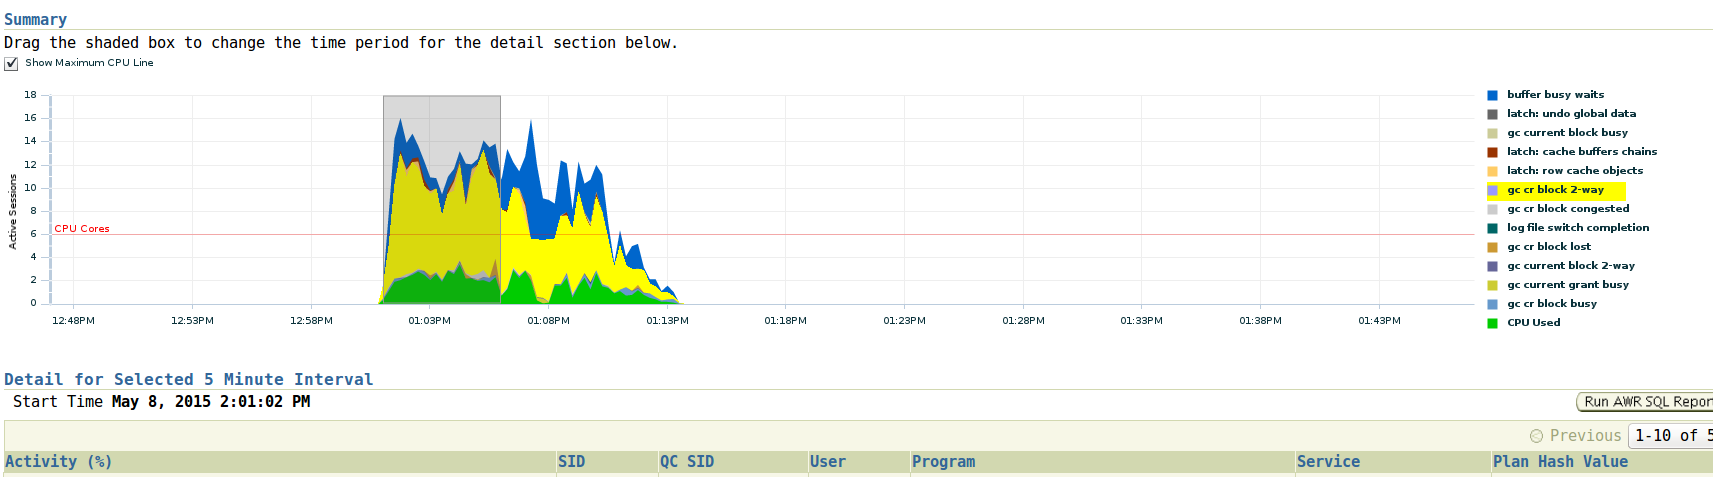
And in this wait class most of the time is taken by events related to the exchange of undo headers!
I dont think this is an index contention issue.(See below for other arguments on this thesis)
I'm leaning to delayed block cleanout but cant find a strong argument that can backup this theory.
Jonhatan Lewis has an interesting chapter on this subjet on his Oracle Core: Essential Internals for DBAs and Developers.
(If someone can give him a bump I would highly appreciate it) :-)
(PS : I''ve changed some object names)
-- details -------------------------------------------
-- version db :
-- Oracle Database 11g Enterprise Edition Release 11.2.0.3.0 - 64bit Production
-- PL/SQL Release 11.2.0.3.0 - Production
-- CORE 11.2.0.3.0 Production
-- TNS for Linux: Version 11.2.0.3.0 - Production
-- NLSRTL Version 11.2.0.3.0 - Production
-- sql_id = 7mwrag9gk8zvr --------------------
insert into <table_name> (VERSION, USR_ID, CREATE_USR_ID, DT_HOR, CREATE_DT_HOR, CONCENTRATOR_ID, BEGIN_DATE, ASSOC_STATE, ASSOC_TYPE, STATUS, LAST_COMM_DATE, REQUEST_ID_UPD, COMPANY_ID, METER_ID) values (:1, :2, :3, :4, :5, :6, :7, :8, :9, :10, :11, :12, :13, :14);
-- table details :: ---------------
OWNER TABLE_NAME PARTITION_NAME LAST_ANLYZD locked stale par monit LOGGING PARAL TOTAL_ROWS AVG_ROW RMOV
--------------- -------------------- -------------------- ------------------- ------- ------ --- ----- ---------- ---------- ---------- ----------------------------------------
<owner> <table_name> 17-05-2015 23:31:36 YES NO YES YES 1 318085 72 DISABLED
table_size = 45 MB
-- table ixs : ------------------
INDEX_OWNER TABLE_NAME INDEX_NAME COLUMN_NAME COLUMN_LENGTH STATUS INDEX_TYPE PAR
-------------------- ------------------------------ ------------------------------ ------------------------- ------------- --------
<owner> <table_name> ISMI_CONC_METER_ASSOC_U2 COMPANY_ID 3 VALID NORMAL NO
<owner> <table_name> ISMI_CONC_METER_ASSOC_U2 METER_ID 22 VALID NORMAL NO
<owner> <table_name> ISMI_CONCENTRATOR_METER_ASSOC2 COMPANY_ID 3 VALID NORMAL NO
<owner> <table_name> ISMI_CONCENTRATOR_METER_ASSOC2 CONCENTRATOR_ID 22 VALID NORMAL NO
-- trigger : -------------------------
CREATE OR REPLACE TRIGGER <trigger_nam>
BEFORE INSERT ON <table_name>
FOR EACH ROW
BEGIN
 IF :NEW.last\_comm\_date IS NULL THEN

   :NEW.last\_comm\_date := :NEW.begin\_date;

 END IF;
END;
/
-- there are only check constraints --------
-- MAIN ----------------------------------------------
Drilling down (either using DBA_HIST_ACTIVE_SESS_HISTORY and tracing the sessions executing taht sql ) I've found that (when agregating the events
and ordering them by their frequency,for the interval considered) the top most events were :
...so from DBA_HIST_ACTIVE_SESS_HISTORY ( aggregating by wait_class ):
--
select sql_id , wait_class , count(wait_class) all_count
from DBA_HIST_ACTIVE_SESS_HISTORY
where sql_id='7mwrag9gk8zvr'
and sample_time > sysdate - 7
group by sql_id ,WAIT_CLASS
order by all_count desc
;
---------------------------------------------------
7mwrag9gk8zvr Cluster 93500
7mwrag9gk8zvr Concurrency 9749
7mwrag9gk8zvr Other 39
7mwrag9gk8zvr Configuration 10
7mwrag9gk8zvr Scheduler 7
7mwrag9gk8zvr User I/O 3
7mwrag9gk8zvr 0
...and when aggregating by p1,p2 and p3 (still from DBA_HIST_ACTIVE_SESS_HISTORY) we have :
-- by p1,p2,p3 -----------------------------------------------------
select sql_id , wait_class
       , p1text , p1

       , p2text , p2

       , p3text , p3

       , count(wait\_class) all\_count
from DBA_HIST_ACTIVE_SESS_HISTORY
where sql_id='7mwrag9gk8zvr'
and sample_time > sysdate - 1
group by sql_id ,WAIT_CLASS
       , p1text , p1

       , p2text , p2

       , p3text , p3
order by all_count desc
;
----
7mwrag9gk8zvr Cluster file# 3 block# 4112 class# 285 715
7mwrag9gk8zvr Cluster file# 4 block# 5632 class# 577 657
7mwrag9gk8zvr Cluster file# 4 block# 4168 class# 473 645
7mwrag9gk8zvr Cluster file# 3 block# 4128 class# 287 644
7mwrag9gk8zvr Cluster file# 4 block# 4152 class# 471 620
7mwrag9gk8zvr Cluster file# 3 block# 272 class# 35 608
7mwrag9gk8zvr Cluster file# 4 block# 2112 class# 569 607
7mwrag9gk8zvr Cluster file# 3 block# 3624 class# 249 588
7mwrag9gk8zvr Cluster file# 3 block# 4888 class# 307 579
7mwrag9gk8zvr Cluster file# 4 block# 4800 class# 541 568
7mwrag9gk8zvr Cluster file# 3 block# 3584 class# 245 564
7mwrag9gk8zvr Cluster file# 4 block# 5032 class# 503 541
7mwrag9gk8zvr Cluster file# 3 block# 4024 class# 277 535
7mwrag9gk8zvr Cluster file# 3 block# 2304 class# 117 532
7mwrag9gk8zvr Cluster file# 3 block# 2288 class# 115 524
7mwrag9gk8zvr Cluster file# 3 block# 1200 class# 75 517
7mwrag9gk8zvr Cluster file# 3 block# 192 class# 25 505
7mwrag9gk8zvr Cluster file# 4 block# 4816 class# 543 497
7mwrag9gk8zvr Cluster file# 3 block# 3992 class# 273 494
... follows an excerpt from a trace file for that sql_id ,on one of the instances : ----
SQL ID: 7mwrag9gk8zvr
Plan Hash: 0
insert into <table_name> (VERSION, USR_ID, CREATE_USR_ID,
DT_HOR, CREATE_DT_HOR, CONCENTRATOR_ID, BEGIN_DATE, ASSOC_STATE, ASSOC_TYPE,
STATUS, LAST_COMM_DATE, REQUEST_ID_UPD, COMPANY_ID, METER_ID)
values
(:1, :2, :3, :4, :5, :6, :7, :8, :9, :10, :11, :12, :13, :14)
call count cpu elapsed disk query current rows
------- ------ -------- ---------- ---------- ---------- ---------- ----------
Parse 1792 0.04 0.03 0 0 0 0
Execute 1792 5.94 46.64 0 332118 120314 1792
Fetch 0 0.00 0.00 0 0 0 0
------- ------ -------- ---------- ---------- ---------- ---------- ----------
total 3584 5.99 46.67 0 332118 120314 1792
Misses in library cache during parse: 1
Misses in library cache during execute: 1
Optimizer mode: ALL_ROWS
Parsing user id: 110
Rows Row Source Operation
------- ---------------------------------------------------
0 LOAD TABLE CONVENTIONAL (cr=19 pr=0 pw=0 time=4231 us)
Elapsed times include waiting on following events:
Event waited on Times Max. Wait Total Waited
---------------------------------------- Waited ---------- ------------
gc buffer busy acquire 23417 0.63 23.62
SQL*Net message to client 1792 0.00 0.00
SQL*Net message from client 1792 0.09 1.42
gc cr block 2-way 13082 0.02 9.04
buffer busy waits 4812 0.06 6.82
gc cr block congested 136 0.00 0.11
latch: cache buffers chains 1403 0.00 0.21
gc cr block busy 230 0.04 0.88
library cache: mutex X 4 0.01 0.01
latch: row cache objects 93 0.00 0.03
gc current block 2-way 180 0.00 0.13
latch: undo global data 14 0.00 0.00
wait list latch free 1 0.00 0.00
gc current grant busy 42 0.00 0.03
gc cr failure 1 0.00 0.00
KJC: Wait for msg sends to complete 24 0.00 0.00
gc current block busy 39 0.00 0.10
gc buffer busy release 7 0.02 0.05
latch: gc element 21 0.00 0.00
gc current grant 2-way 3 0.00 0.00
gc current block congested 3 0.00 0.00
latch: object queue header operation 2 0.00 0.00
read by other session 1 0.00 0.00
latch: redo allocation 1 0.00 0.00
********************************************************************************
... .......
Fast forwarding (rather than dumping here all the reports and traces and other info from awr already collected) ... I tried to 'simulate'
this behaviour on a 'controlled environment' (my 2 node RAC 11.2 on virtual box) :
So I opened 4 sessions.3 in the first node and the last on the 2nd node.
In the 1st 3 sessions I execute :
insert into fer.o1 select 0 , rpad(to_char(rownum), 100, '*') from dual ;
(NOTE:the 'strange' rpad was only to restrict block changes to only one block between the instances.)
After this,and in the 4th session ,I execute the same insert (while tracing it).
(Follows a grep by "p1=3\|p1=6" in that trace file) :
(files 3 and 6 are,respectively ,the undo files from both nodes)
And,in this case ,as per the trace file ,I see the undo header blocks being shipped from node 1 to node 2 ,at the begging of the insert execution :
WAIT #3: nam='gc cr block 2-way' ela= 356 p1=3 p2=176 p3=23 obj#=0 tim=1431626015408494
WAIT #3: nam='gc cr block 2-way' ela= 316 p1=3 p2=160 p3=21 obj#=0 tim=1431626015409179
WAIT #3: nam='gc cr block 2-way' ela= 662 p1=3 p2=166512 p3=61 obj#=0 tim=1431626015410807
WAIT #3: nam='gc current grant busy' ela= 1019 p1=6 p2=128 p3=33620005 obj#=0 tim=1431626693586438
WAIT #3: nam='gc cr block 2-way' ela= 194 p1=3 p2=272 p3=35 obj#=0 tim=1431626829171096
WAIT #3: nam='gc cr block 2-way' ela= 330 p1=3 p2=240 p3=31 obj#=0 tim=1431626829171595
WAIT #3: nam='gc cr block 2-way' ela= 278 p1=3 p2=256 p3=33 obj#=0 tim=1431626829172013
(to find out p3 class ,I used Tanel Poder''s script = http://blog.tanelpoder.com/files/scripts/bclass.sql)
Im resuming now,otherwise I fear to sum and mix too much information in a single post.
Only to add that,as suggested by some friends (index contention),if I was facing an index contention problem I was expecting (for RIGHT HANDED SIDE index growth for example) ,an higher frequency of index related events.And that was not the case.In those cases (I also created a test case with this,but not shown here) it was observed that the blocks exchanged were those of the index and when aggregating by event for the interesting interval the top events were enq TX : index contention and p1,p2,and p3 show those index blocks.
More,... in the production case I have a delete on that table before that insert :
delete from <table_name> where COMPANY_ID=:1 and METER_ID=:2;
(I was expecting to see the creation of consistent images for this delete (as they did)).But if there was 'real' CR image on the insert (due to this delete....somehow) ...I would see the actual undo data blocks being exchanged (rather than only the headers)
I also enabled events = 10200,10201 and 10220 and I 'see' no undo changes.Neither (as for the cases when CR images are being generated) the exchange of
the actual undo blocks (those with the pertinent vectors to the rollback of the current image).
For the test case (in my controlled environment) I see calls to ktugct function but not in the same number as the undo header blocks with uncommited transactions.(I was expecting this to happen in the delayed block cleanout case,but maybe I dont fully realize the inner works of ktugct).Even so,the undo header changes do not get logged in the trace file (only those for the actual insert [for the test case]).So I can't understand how this can fully be seen as a delayed blk cleanout without changes to undo header being reported (logged) by trace event = 10220
Furthermore,in my test case ,the block exchange only happens when initiating the transaction.Meaning that the undo block header exchange is a one-time only happening ,in the life of the transaction.Which led me to think this could be an operation such as a delayed block cleanout for the session to 'verify' if the apparent pending/uncommitted transactions are 'real' ones and not just the missing work of former sessions.
Help is appreciated , Thank you very much
FG
(Meanwhile If someone can tell me how to attach trc and sql files I'd appreciate it ,thank you)
(Im pasting sql for the test case,so that is easier to relate to what I said about it)
drop table fer.o1 purge ;
create table fer.o1 (id number , nome varchar2(4000));
insert into fer.o1
select 1 , rpad(to_char(rownum), 4000, '*')
from dual
connect by level < 6
;
insert into fer.o1
select 1 , rpad(to_char(rownum), 1000, '*')
from dual
;
insert into fer.o1
select 1 , rpad(to_char(rownum), 100, '*')
from dual
;
commit ;
alter system flush buffer_cache ;
select rowid , DBMS_ROWID.ROWID_BLOCK_NUMBER(rowid) blk_nr , o.*
from fer.o1 o
;
-- ==========================================
--76037
select *
from v$bh
where objd=(select object_id from dba_objects where owner='FER' and object_name='O1')
;
(Im pasting an excerpt of a trace file from our prodution machine.The same that produced the tkprof excerpt in this post)
=====================
PARSING IN CURSOR #47478322724600 len=77 dep=0 uid=110 oct=7 lid=110 tim=1431105115554664 hv=784147179 ad='7ff296f8' sqlid='3xbhjyhrbu8rb'
delete from <table_name> where COMPANY_ID=:1 and METER_ID=:2
END OF STMT
PARSE #47478322724600:c=0,e=168,p=0,cr=0,cu=0,mis=0,r=0,dep=0,og=1,plh=2684217200,tim=1431105115554663
WAIT #47478322724600: nam='gc current block 2-way' ela= 402 p1=52 p2=2568429 p3=33554433 obj#=80745 tim=1431105115555244
WAIT #47478322724600: nam='gc current block 2-way' ela= 652 p1=158 p2=2097653 p3=33554433 obj#=96572 tim=1431105115556040
EXEC #47478322724600:c=0,e=1418,p=0,cr=3,cu=7,mis=0,r=1,dep=0,og=1,plh=2684217200,tim=1431105115556160
STAT #47478322724600 id=1 cnt=0 pid=0 pos=1 obj=0 op='DELETE <table_name> (cr=3 pr=0 pw=0 time=1391 us)'
STAT #47478322724600 id=2 cnt=1 pid=1 pos=1 obj=319388 op='INDEX UNIQUE SCAN ISMI_CONC_METER_ASSOC_U2 (cr=3 pr=0 pw=0 time=18 us cost=2 size=14 card=1)'
WAIT #47478322724600: nam='SQL*Net message to client' ela= 2 driver id=1413697536 #bytes=1 p3=0 obj#=-1 tim=1431105115556336
WAIT #47478322724600: nam='SQL*Net message from client' ela= 600 driver id=1413697536 #bytes=1 p3=0 obj#=-1 tim=1431105115556964
CLOSE #47478322724600:c=0,e=4,dep=0,type=0,tim=1431105115557018
=====================
PARSING IN CURSOR #47478322724600 len=282 dep=0 uid=110 oct=2 lid=110 tim=1431105115557339 hv=1596227447 ad='9d4586488' sqlid='7mwrag9gk8zvr'
insert into <table_name> (VERSION, USR_ID, CREATE_USR_ID, DT_HOR, CREATE_DT_HOR, CONCENTRATOR_ID, BEGIN_DATE, ASSOC_STATE, ASSOC_TYPE, STATUS, LAST_COMM_DATE, REQUEST_ID_UPD, COMPANY_ID, METER_ID) values (:1, :2, :3, :4, :5, :6, :7, :8, :9, :10, :11, :12, :13, :14)
END OF STMT
PARSE #47478322724600:c=1000,e=259,p=0,cr=0,cu=0,mis=0,r=0,dep=0,og=1,plh=0,tim=1431105115557338
EXEC #47478322724600:c=0,e=320,p=0,cr=14,cu=13,mis=0,r=1,dep=0,og=1,plh=0,tim=1431105115557764
STAT #47478322724600 id=1 cnt=0 pid=0 pos=1 obj=0 op='LOAD TABLE CONVENTIONAL (cr=14 pr=0 pw=0 time=209 us)'
WAIT #47478322724600: nam='SQL*Net message to client' ela= 1 driver id=1413697536 #bytes=1 p3=0 obj#=-1 tim=1431105115557867
WAIT #47478322724600: nam='SQL*Net message from client' ela= 292 driver id=1413697536 #bytes=1 p3=0 obj#=-1 tim=1431105115558214
CLOSE #47478322724600:c=0,e=11,dep=0,type=0,tim=1431105115558269
=====================
PARSING IN CURSOR #47478322724600 len=77 dep=0 uid=110 oct=7 lid=110 tim=1431105115558358 hv=784147179 ad='7ff296f8' sqlid='3xbhjyhrbu8rb'
delete from <table_name> where COMPANY_ID=:1 and METER_ID=:2
END OF STMT
PARSE #47478322724600:c=0,e=30,p=0,cr=0,cu=0,mis=0,r=0,dep=0,og=1,plh=2684217200,tim=1431105115558357
WAIT #47478322724600: nam='gc current block 2-way' ela= 384 p1=39 p2=2076399 p3=33554433 obj#=80745 tim=1431105115558934
EXEC #47478322724600:c=0,e=633,p=0,cr=3,cu=7,mis=0,r=1,dep=0,og=1,plh=2684217200,tim=1431105115559072
STAT #47478322724600 id=1 cnt=0 pid=0 pos=1 obj=0 op='DELETE <table_name> (cr=3 pr=0 pw=0 time=610 us)'
STAT #47478322724600 id=2 cnt=1 pid=1 pos=1 obj=319388 op='INDEX UNIQUE SCAN ISMI_CONC_METER_ASSOC_U2 (cr=3 pr=0 pw=0 time=18 us cost=2 size=14 card=1)'
WAIT #47478322724600: nam='SQL*Net message to client' ela= 1 driver id=1413697536 #bytes=1 p3=0 obj#=-1 tim=1431105115559225
WAIT #47478322724600: nam='SQL*Net message from client' ela= 448 driver id=1413697536 #bytes=1 p3=0 obj#=-1 tim=1431105115559701
CLOSE #47478322724600:c=0,e=11,dep=0,type=1,tim=1431105115559750
=====================
PARSING IN CURSOR #47478324840384 len=282 dep=0 uid=110 oct=2 lid=110 tim=1431105115559839 hv=1596227447 ad='9d4586488' sqlid='7mwrag9gk8zvr'
insert into <table_name> (VERSION, USR_ID, CREATE_USR_ID, DT_HOR, CREATE_DT_HOR, CONCENTRATOR_ID, BEGIN_DATE, ASSOC_STATE, ASSOC_TYPE, STATUS, LAST_COMM_DATE, REQUEST_ID_UPD, COMPANY_ID, METER_ID) values (:1, :2, :3, :4, :5, :6, :7, :8, :9, :10, :11, :12, :13, :14)
END OF STMT
PARSE #47478324840384:c=0,e=32,p=0,cr=0,cu=0,mis=0,r=0,dep=0,og=1,plh=0,tim=1431105115559838
EXEC #47478324840384:c=0,e=197,p=0,cr=14,cu=13,mis=0,r=1,dep=0,og=1,plh=0,tim=1431105115560100
STAT #47478324840384 id=1 cnt=0 pid=0 pos=1 obj=0 op='LOAD TABLE CONVENTIONAL (cr=14 pr=0 pw=0 time=141 us)'
WAIT #47478324840384: nam='SQL*Net message to client' ela= 1 driver id=1413697536 #bytes=1 p3=0 obj#=-1 tim=1431105115560202
WAIT #47478324840384: nam='SQL*Net message from client' ela= 334 driver id=1413697536 #bytes=1 p3=0 obj#=-1 tim=1431105115560573
CLOSE #47478324840384:c=0,e=22,dep=0,type=1,tim=1431105115560634
PARSE #47478322724600:c=0,e=15,p=0,cr=0,cu=0,mis=0,r=0,dep=0,og=1,plh=2684217200,tim=1431105115560688
EXEC #47478322724600:c=0,e=136,p=0,cr=3,cu=7,mis=0,r=1,dep=0,og=1,plh=2684217200,tim=1431105115560858
WAIT #47478322724600: nam='SQL*Net message to client' ela= 1 driver id=1413697536 #bytes=1 p3=0 obj#=-1 tim=1431105115560901
WAIT #47478322724600: nam='SQL*Net message from client' ela= 840 driver id=1413697536 #bytes=1 p3=0 obj#=-1 tim=1431105115561763
CLOSE #47478322724600:c=0,e=5,dep=0,type=3,tim=1431105115561811
PARSE #47478324840384:c=0,e=16,p=0,cr=0,cu=0,mis=0,r=0,dep=0,og=1,plh=0,tim=1431105115561879
EXEC #47478324840384:c=0,e=196,p=0,cr=14,cu=13,mis=0,r=1,dep=0,og=1,plh=0,tim=1431105115562106
WAIT #47478324840384: nam='SQL*Net message to client' ela= 1 driver id=1413697536 #bytes=1 p3=0 obj#=-1 tim=1431105115562160
WAIT #47478324840384: nam='SQL*Net message from client' ela= 253 driver id=1413697536 #bytes=1 p3=0 obj#=-1 tim=1431105115562437
CLOSE #47478324840384:c=0,e=13,dep=0,type=3,tim=1431105115562499
PARSE #47478322724600:c=0,e=20,p=0,cr=0,cu=0,mis=0,r=0,dep=0,og=1,plh=2684217200,tim=1431105115562576
EXEC #47478322724600:c=0,e=133,p=0,cr=3,cu=7,mis=0,r=1,dep=0,og=1,plh=2684217200,tim=1431105115562749
WAIT #47478322724600: nam='SQL*Net message to client' ela= 1 driver id=1413697536 #bytes=1 p3=0 obj#=-1 tim=1431105115562791
WAIT #47478322724600: nam='SQL*Net message from client' ela= 363 driver id=1413697536 #bytes=1 p3=0 obj#=-1 tim=1431105115563175
CLOSE #47478322724600:c=0,e=5,dep=0,type=3,tim=1431105115563224
PARSE #47478324840384:c=0,e=21,p=0,cr=0,cu=0,mis=0,r=0,dep=0,og=1,plh=0,tim=1431105115563315
WAIT #47478324840384: nam='gc cr block 2-way' ela= 297 p1=3 p2=2208 p3=105 obj#=0 tim=1431105115563958
EXEC #47478324840384:c=0,e=753,p=0,cr=23,cu=14,mis=0,r=1,dep=0,og=1,plh=0,tim=1431105115564129
WAIT #47478324840384: nam='SQL*Net message to client' ela= 1 driver id=1413697536 #bytes=1 p3=0 obj#=0 tim=1431105115564206
WAIT #47478324840384: nam='SQL*Net message from client' ela= 345 driver id=1413697536 #bytes=1 p3=0 obj#=0 tim=1431105115564607
CLOSE #47478324840384:c=0,e=11,dep=0,type=3,tim=1431105115564652
PARSE #47478322724600:c=0,e=21,p=0,cr=0,cu=0,mis=0,r=0,dep=0,og=1,plh=2684217200,tim=1431105115564748
WAIT #47478322724600: nam='gc current block 2-way' ela= 229 p1=39 p2=2076289 p3=33554440 obj#=80745 tim=1431105115565229
EXEC #47478322724600:c=1000,e=630,p=0,cr=3,cu=9,mis=0,r=1,dep=0,og=1,plh=2684217200,tim=1431105115565446
WAIT #47478322724600: nam='SQL*Net message to client' ela= 1 driver id=1413697536 #bytes=1 p3=0 obj#=-1 tim=1431105115565520
WAIT #47478322724600: nam='SQL*Net message from client' ela= 347 driver id=1413697536 #bytes=1 p3=0 obj#=-1 tim=1431105115565903
CLOSE #47478322724600:c=0,e=5,dep=0,type=3,tim=1431105115565943
PARSE #47478324840384:c=0,e=26,p=0,cr=0,cu=0,mis=0,r=0,dep=0,og=1,plh=0,tim=1431105115566016
EXEC #47478324840384:c=999,e=302,p=0,cr=20,cu=15,mis=0,r=1,dep=0,og=1,plh=0,tim=1431105115566360
WAIT #47478324840384: nam='SQL*Net message to client' ela= 1 driver id=1413697536 #bytes=1 p3=0 obj#=-1 tim=1431105115566420
WAIT #47478324840384: nam='SQL*Net message from client' ela= 477 driver id=1413697536 #bytes=1 p3=0 obj#=-1 tim=1431105115566922
CLOSE #47478324840384:c=0,e=21,dep=0,type=3,tim=1431105115566989
PARSE #47478322724600:c=0,e=25,p=0,cr=0,cu=0,mis=0,r=0,dep=0,og=1,plh=2684217200,tim=1431105115567070
WAIT #47478322724600: nam='gc cr block 2-way' ela= 654 p1=143 p2=644691 p3=1 obj#=319388 tim=1431105115567856
WAIT #47478322724600: nam='gc current block 2-way' ela= 517 p1=39 p2=2076358 p3=33554433 obj#=80745 tim=1431105115568532
WAIT #47478322724600: nam='gc current block 2-way' ela= 397 p1=143 p2=644691 p3=33554433 obj#=319388 tim=1431105115569133
EXEC #47478322724600:c=1000,e=2144,p=0,cr=3,cu=7,mis=0,r=1,dep=0,og=1,plh=2684217200,tim=1431105115569257
WAIT #47478322724600: nam='SQL*Net message to client' ela= 1 driver id=1413697536 #bytes=1 p3=0 obj#=-1 tim=1431105115569332
WAIT #47478322724600: nam='SQL*Net message from client' ela= 431 driver id=1413697536 #bytes=1 p3=0 obj#=-1 tim=1431105115569799
CLOSE #47478322724600:c=0,e=5,dep=0,type=3,tim=1431105115569860
PARSE #47478324840384:c=0,e=17,p=0,cr=0,cu=0,mis=0,r=0,dep=0,og=1,plh=0,tim=1431105115569947
WAIT #47478324840384: nam='gc cr block 2-way' ela= 313 p1=3 p2=2208 p3=105 obj#=0 tim=1431105115570602
WAIT #47478324840384: nam='gc cr block 2-way' ela= 654 p1=3 p2=3624 p3=249 obj#=0 tim=1431105115571519
EXEC #47478324840384:c=1000,e=1680,p=0,cr=27,cu=16,mis=0,r=1,dep=0,og=1,plh=0,tim=1431105115571669
WAIT #47478324840384: nam='SQL*Net message to client' ela= 1 driver id=1413697536 #bytes=1 p3=0 obj#=0 tim=1431105115571866
WAIT #47478324840384: nam='SQL*Net message from client' ela= 598 driver id=1413697536 #bytes=1 p3=0 obj#=0 tim=1431105115572632
FG