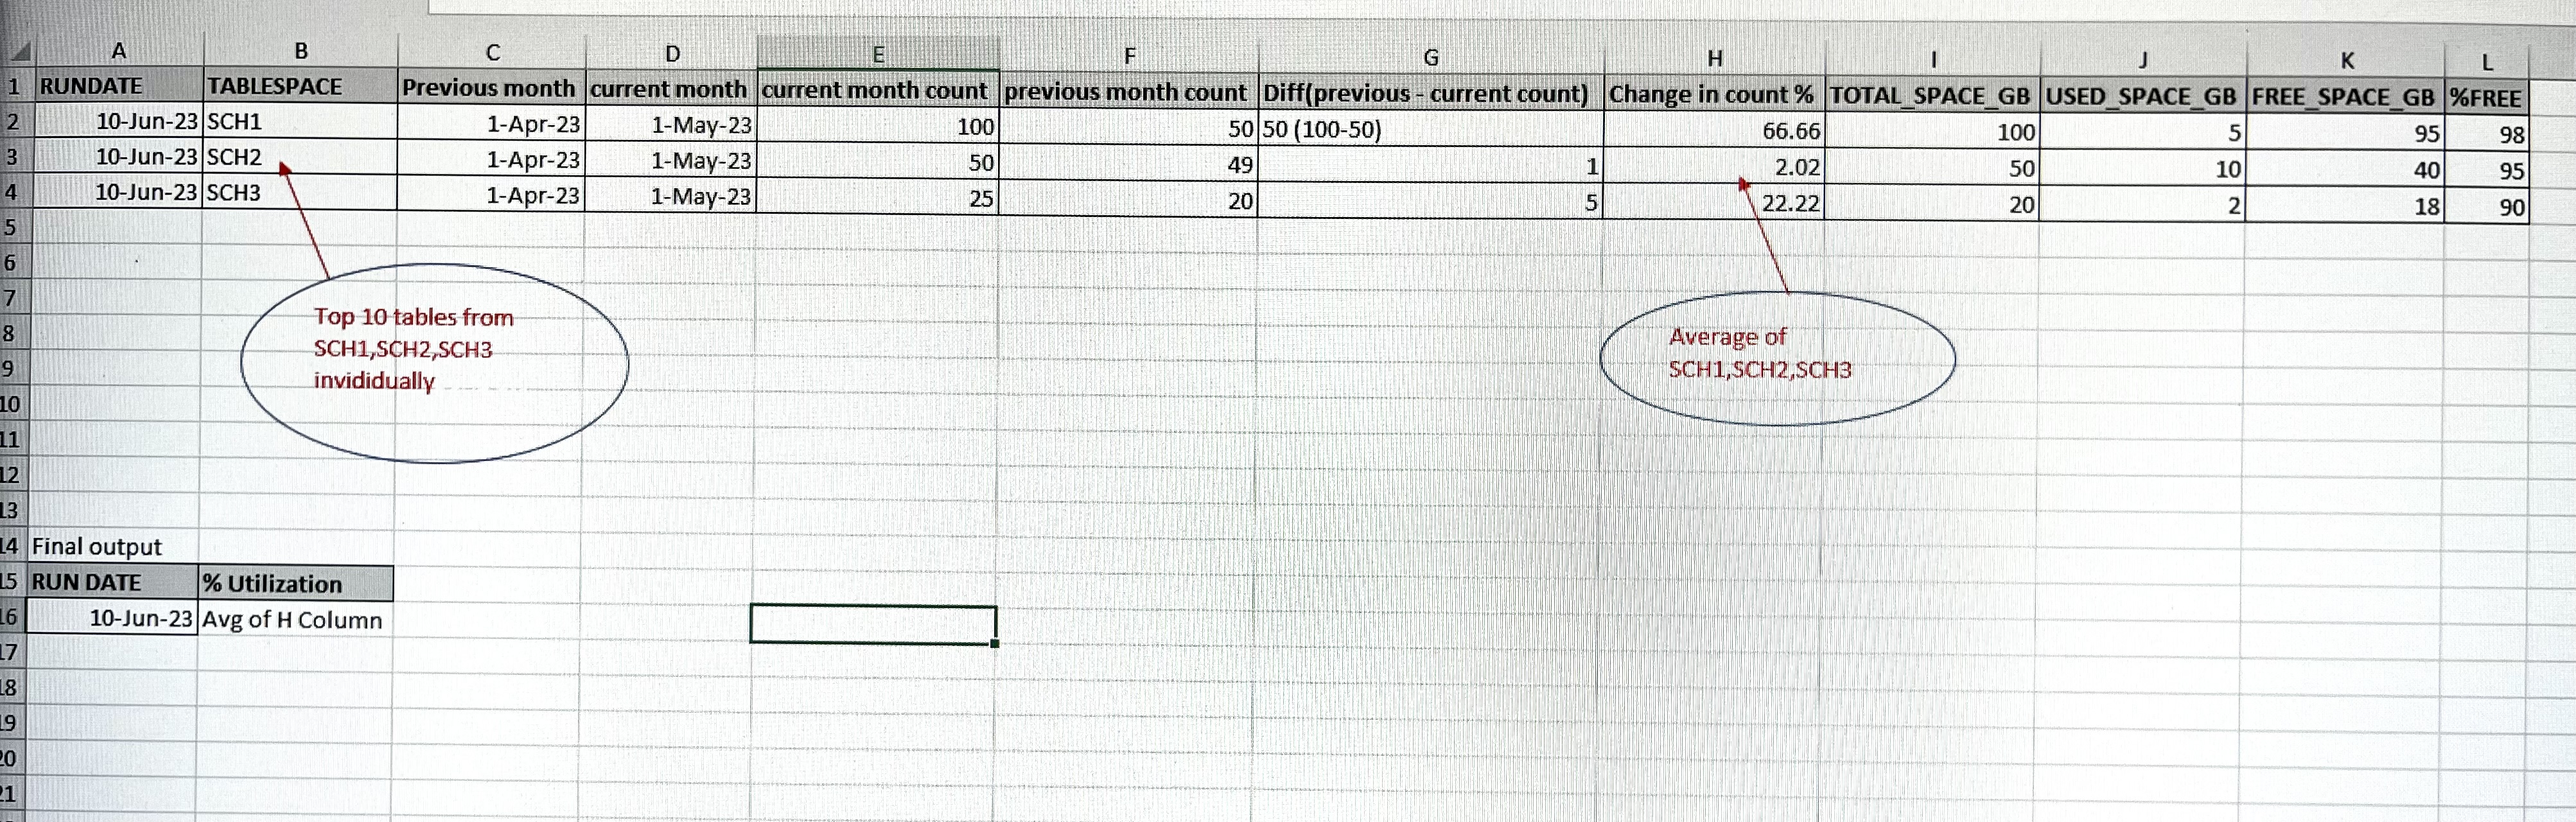
I want get a report of table utilisation % for top 10 tables of each owner in database. For example I have my database divided in 3 schema SCH1, SCH2, SCH3.. I have to get the top 10 utilised table under each and find the overall growth of the database on month level.
for example- each schema has 10% growth every month. So at database level it’s totally 30 % but overall taking top 10 I need to find the growth %. Below excel final output is the expected. How to find the growth % .. RUN DATE is the date I’m running the report