here is the case. I use the OpenAI API to translate the NL to SQL and draw a tabel/report via HTML5+JS successfully. Now I try to draw charts like bar or pie via JET using this data (in json format) generated dynamically.
Below is the JS function I put into the Page Function and Global Variable Declaration.
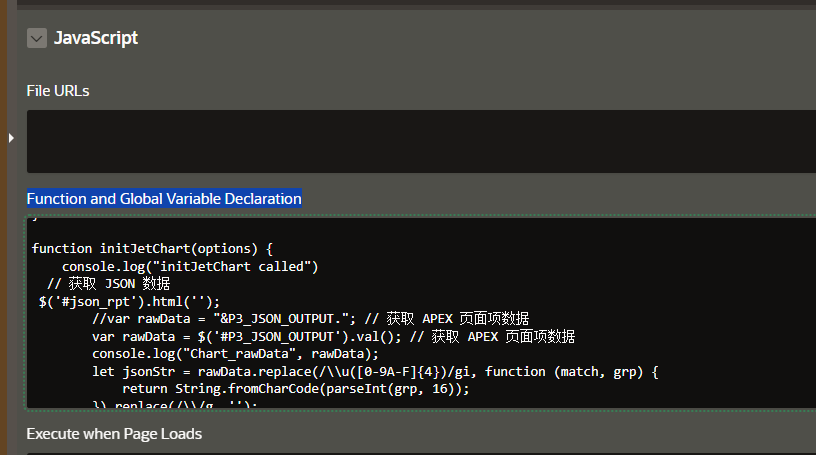
function initJetChart(options) {
console.log("initJetChart called")
// get JSON data
$('#json_rpt').html('');
// json data is in the APEX item
var rawData = $('#P3_JSON_OUTPUT').val();
console.log("Chart_rawData", rawData);
//convert json data in correct format
let jsonStr = rawData.replace(/\\u([0-9A-F]{4})/gi, function (match, grp) {
return String.fromCharCode(parseInt(grp, 16));
}).replace(/\\/g, '');


// validate json data
if (jsonStr) {
var jsonData = JSON.parse(jsonStr);
console.log("Chart_parseData", jsonStr);


var sampleRecord = jsonData[0];
var xField = null;
var yField = null;

// check column, if string set to X, if number set to Y
for (var key in sampleRecord) {
if (sampleRecord.hasOwnProperty(key)) {
if (typeof sampleRecord[key] === 'string') {
xField = key;
} else if (typeof sampleRecord[key] === 'number') {
yField = key;
}
}
}

console.log("X Field:", xField, "Y Field:", yField);


if (xField && yField) {
// map the json data for JET
var seriesData = [{
name: "New",
items: jsonData.map(function(item) {
return {
label: item[xField],
value: item[yField]
};
})
}];

console.log("Formatted Series Data:", seriesData);

// retrun the JET data
options.series = seriesData;
console.log("Series_Data:", options.series)

// refresh Chart region
 apex.region("chart_bar").refresh();

} else {
console.error("Data error");
}
}
}
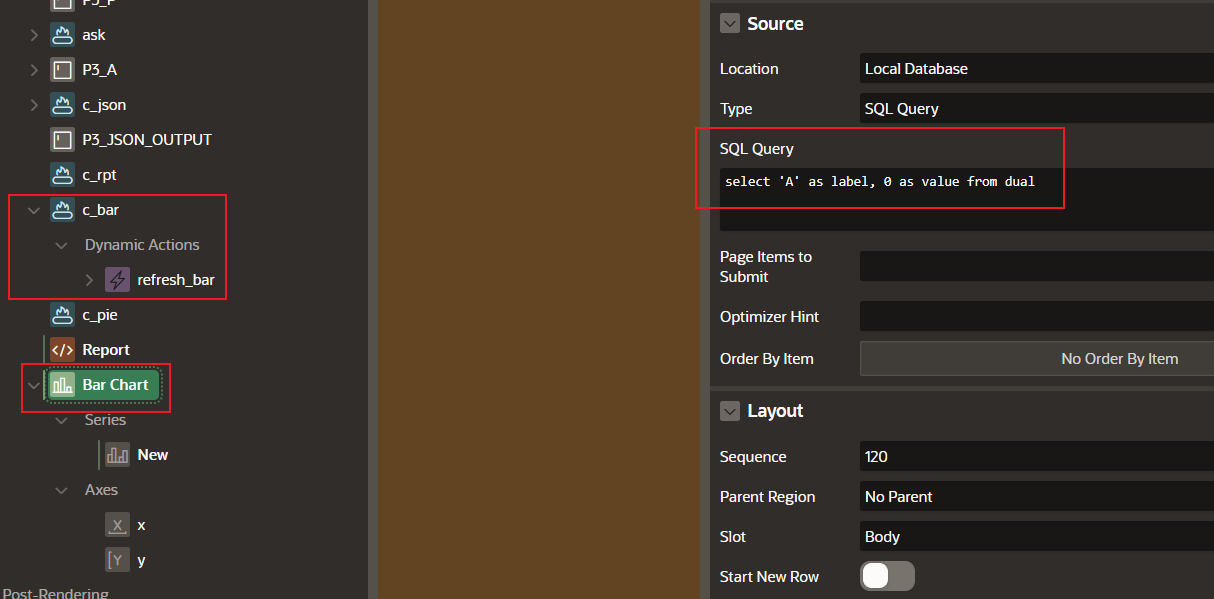
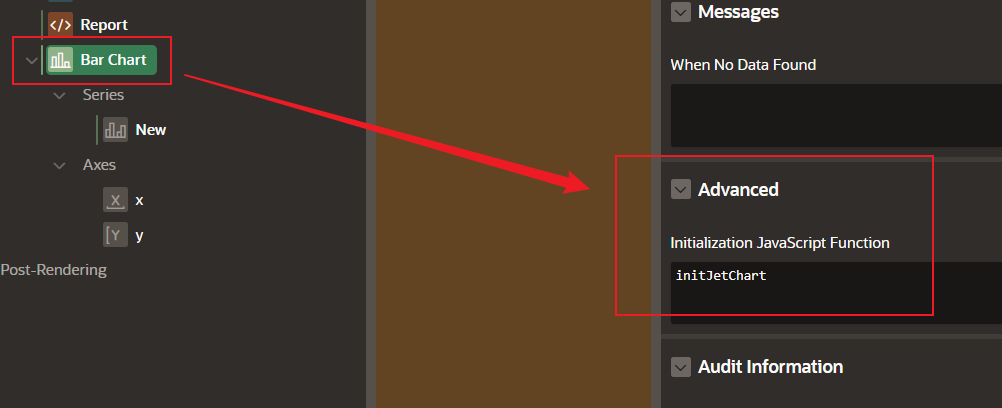
Then I create a Chart and a button to refresh the Chart region. In the Chart Source, I need to input a static sql to initialize the chart region. Also, I call the function above in the Chart Attribute/Advanced.
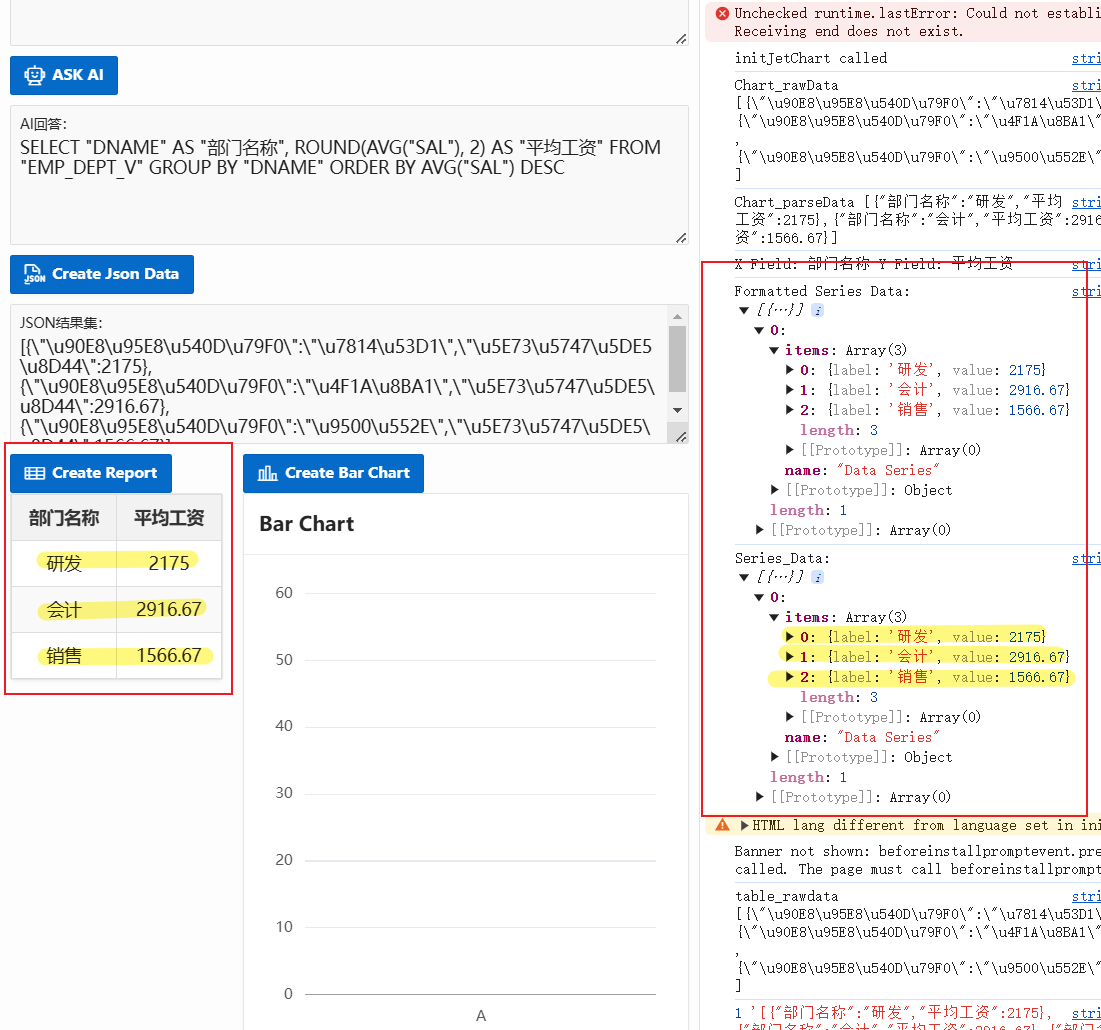
The result looks good, also in the function array. But the bar chart keep remaining in the original static bar. Is there something/step I missed?