Dear All,
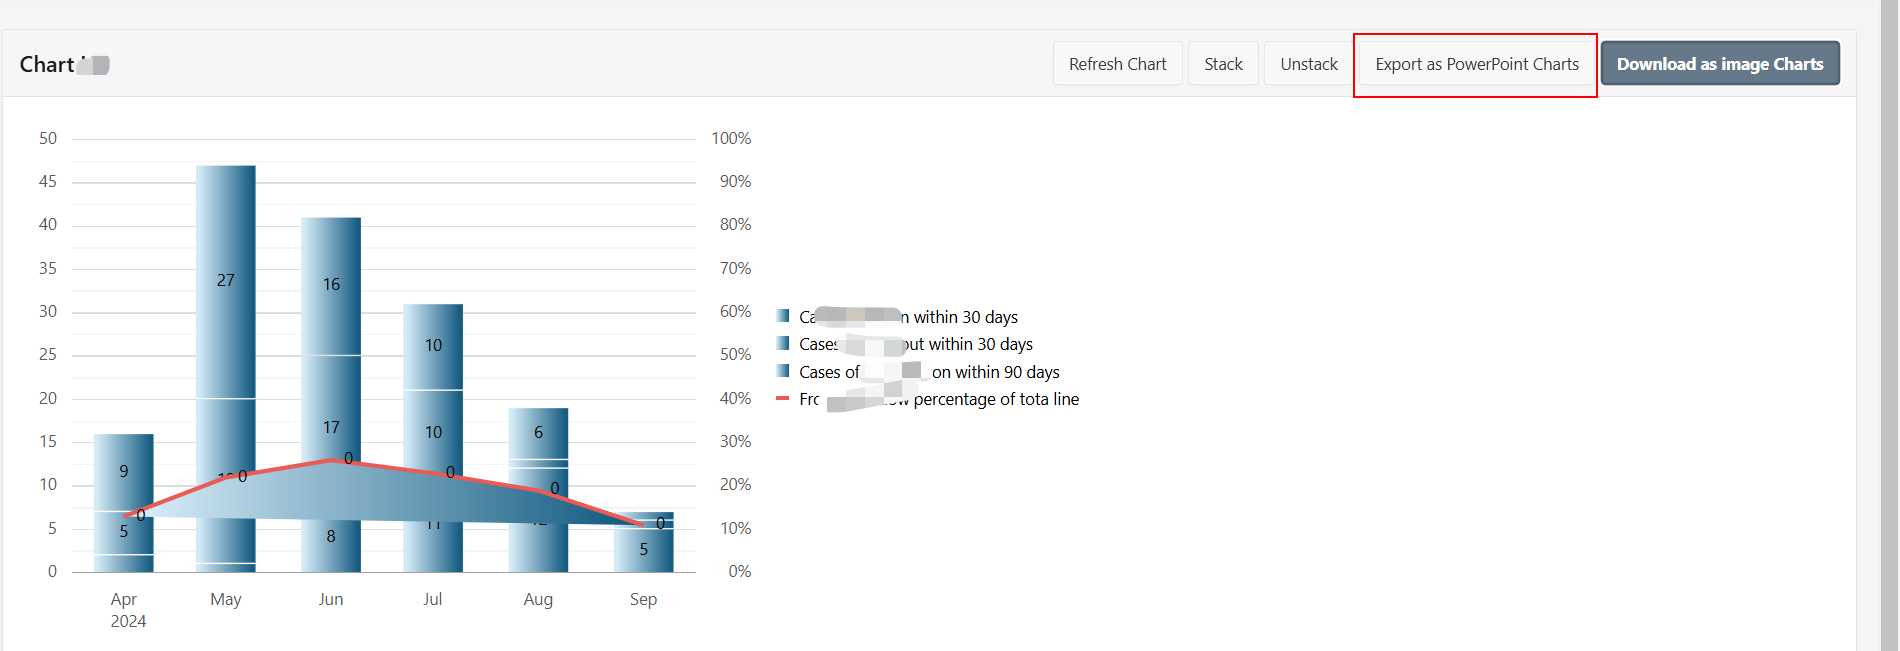
I want to export the chart to Excel or PPT, I tried to export the PPT, press the following steps, click the red button below, no response:
Help me see where I went wrong, finally click the output Point button did not respond, the correct is to click on the output of a PPT file export Charts picture.
In addition, can I export to Excel?
1、Chart Region > Attributes Tab > Initialization JavaScript Function > add this function for each chart region.
function( options ){
options.dataFilter = function( data ) {
   data\_chart.push( data.series);

   return data;
};
options_chart.push(options);
return options;
}
2、In the page level > HTML Header we need to define the client-side script for PptxGenJS.
<script src="https://cdn.jsdelivr.net/gh/gitbrent/pptxgenjs@3.3.1/libs/jszip.min.js"></script>
<script src="https://cdn.jsdelivr.net/gh/gitbrent/pptxgenjs@3.3.1/dist/pptxgen.min.js"></script>
3、In Page level add the below in Function and Global Variable Declaration.
var data_chart = [];
var options_chart = [];
// Function to generate PowerPoint
async function genratePowerPoint() {
var pptx = new PptxGenJS();
// Create an array to store promises for each chart
var promises = [];
// Process each region
for (var i = 0; i < data_chart.length; i++) {
var chartData = data_chart[i];
var chartOptions = options_chart[i];
// Push the promise to the array
promises.push(generateChartSlide(pptx, chartData, chartOptions));
}
// Wait for all promises to finish
await Promise.all(promises);
// Save the presentation
pptx.writeFile("chart_genrated.pptx");
}
// Function to generate chart slide
function generateChartSlide(pptx, chartData, chartOptions) {
return new Promise((resolve, reject) => {
// Generate chart using getChartDataForRegion
var slide = pptx.addSlide();
var chartDataProcessed = getChartDataForRegion(chartData);
slide.addChart(chartOptions.type, chartDataProcessed, {
x: 0,
y: 0,
w: 10,
h: 5.6,
title: Object.values(chartOptions.translations)[0],
showLegend: true,
lineType: "solid",
showLabel: true,
showTitle: true,
showValue: true,
});
resolve(); // Resolve the promise
});
}
// Function to retrieve chart data for a specific chart
function getChartDataForRegion(chartData) {
const data = [];
chartData.forEach(function (series) {
const dataItem = {
name: series.name,
labels: [],
values: [],
index: 0,
};
series.items.forEach(function (item) {
dataItem.labels.push(item.name);
dataItem.values.push(item.value);
});
data.push(dataItem);
});
return data;
}
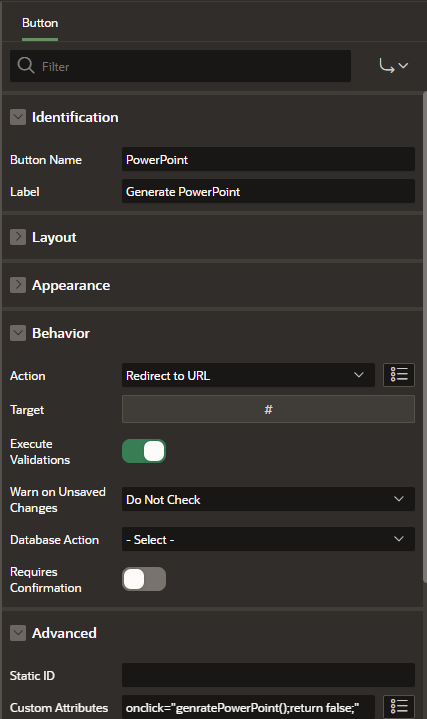
4、Finally call genratePowerPoint function using button.
参考-- Abdullah Azmi August 23, 2023
Best regards,
G.H