Hello,
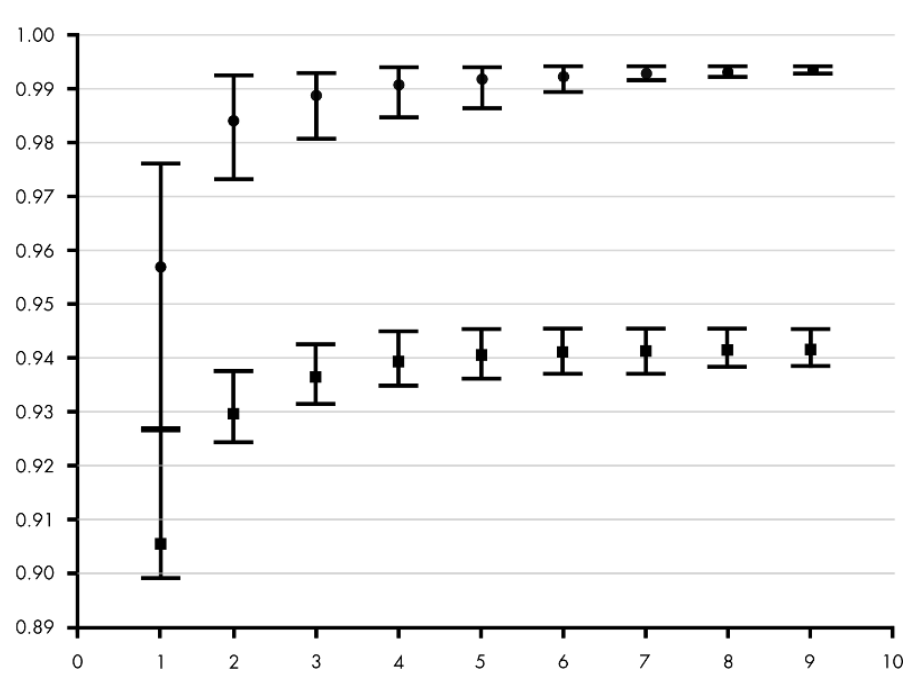
Is there a way to display +/- error boundary tickmarks on a scatter plot chart? See the image below for an example of what I'm intending to do.
I also need the x-axis to be time based which I've ready you need to use a line chart with event drops.
Is this functionality available using JET charts? Is there a way to render the charts using other javascript libraries?
Thanks,
JP